|

USD/JPY technical analysis: Greenback makes modest progress against Yen, near 106.30

  • The demand for Yen as a safe-haven currency has been weak in the last three days. 
  • The levels to beat for bulls are at the 106.30 and 106.55 resistances.
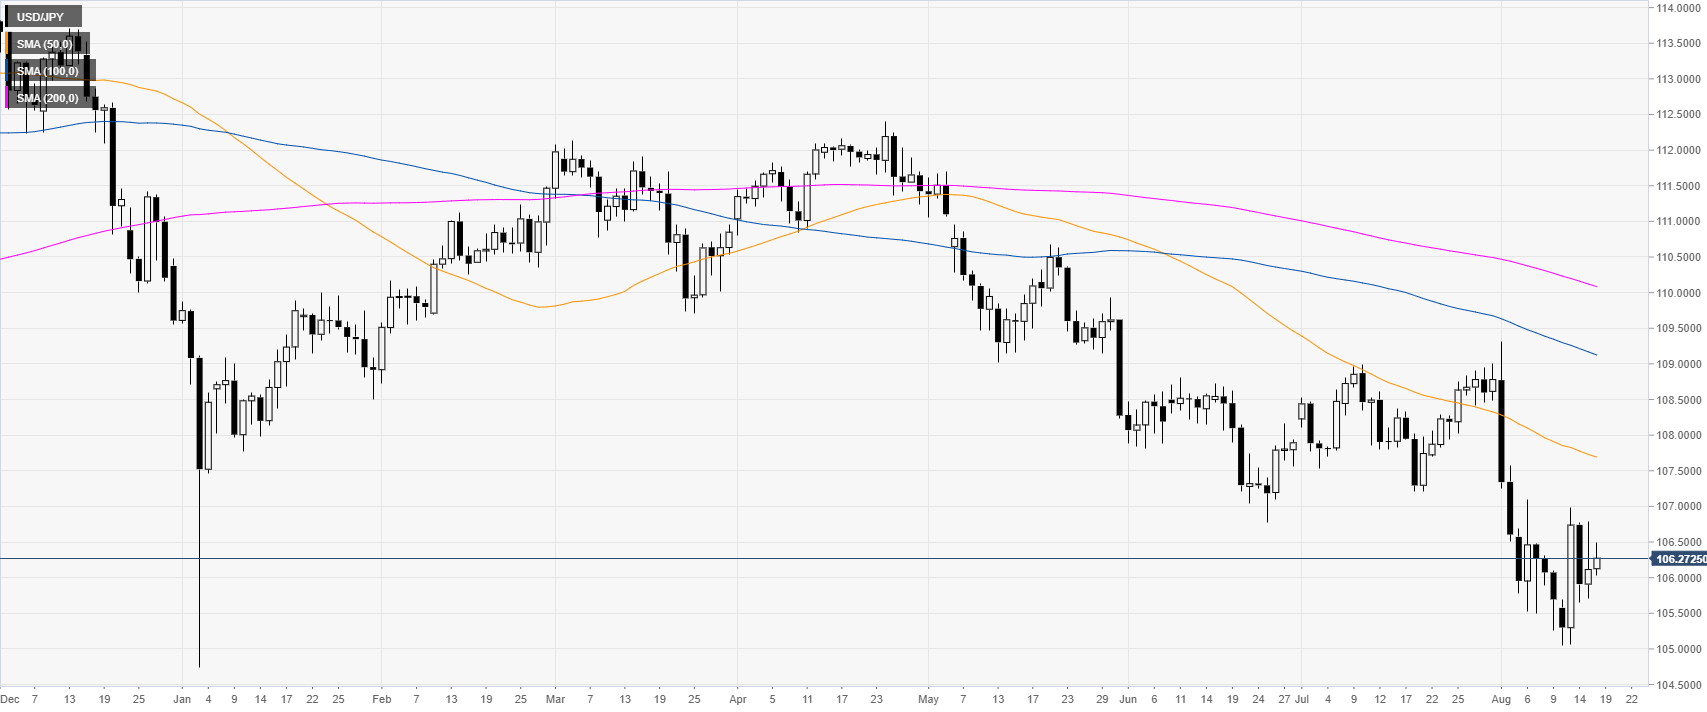
 

USD/JPY daily chart


USD/JPY is trading off multi-month lows while under the main daily simple moving averages (DSMAs). The market is trading just above the 106.00 handle. Trade war news and US bond yields are the primary drivers of the USD/JPY currency pair.
 

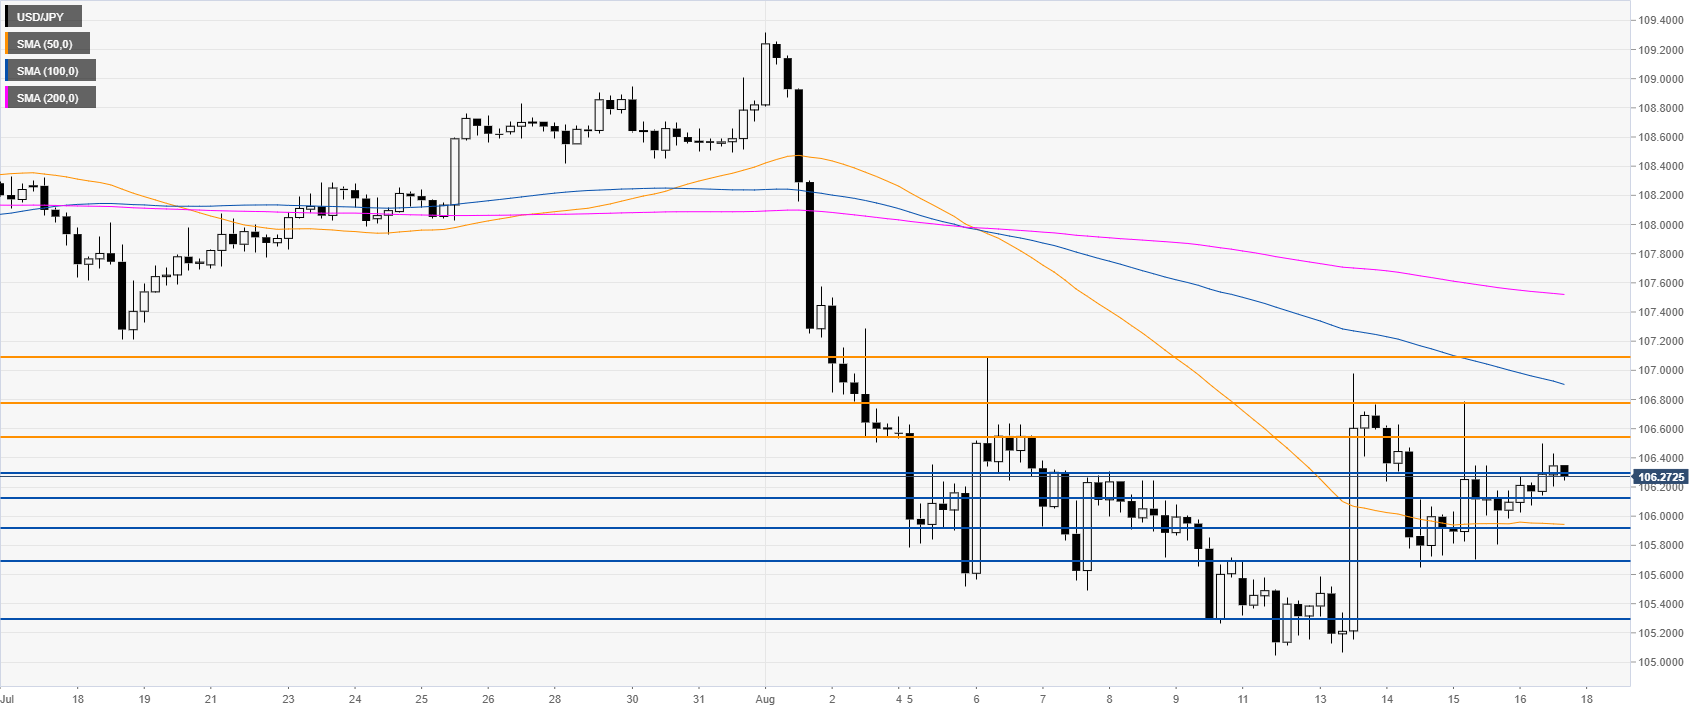
USD/JPY 4-hour chart

 
USD/JPY made no significant progress in the last two days as the market is trading above the 50 SMA. The bears would need to break below 106.12 to reach 105.92, 105.68 and 105.30, according to the Technical Confluences Indicator


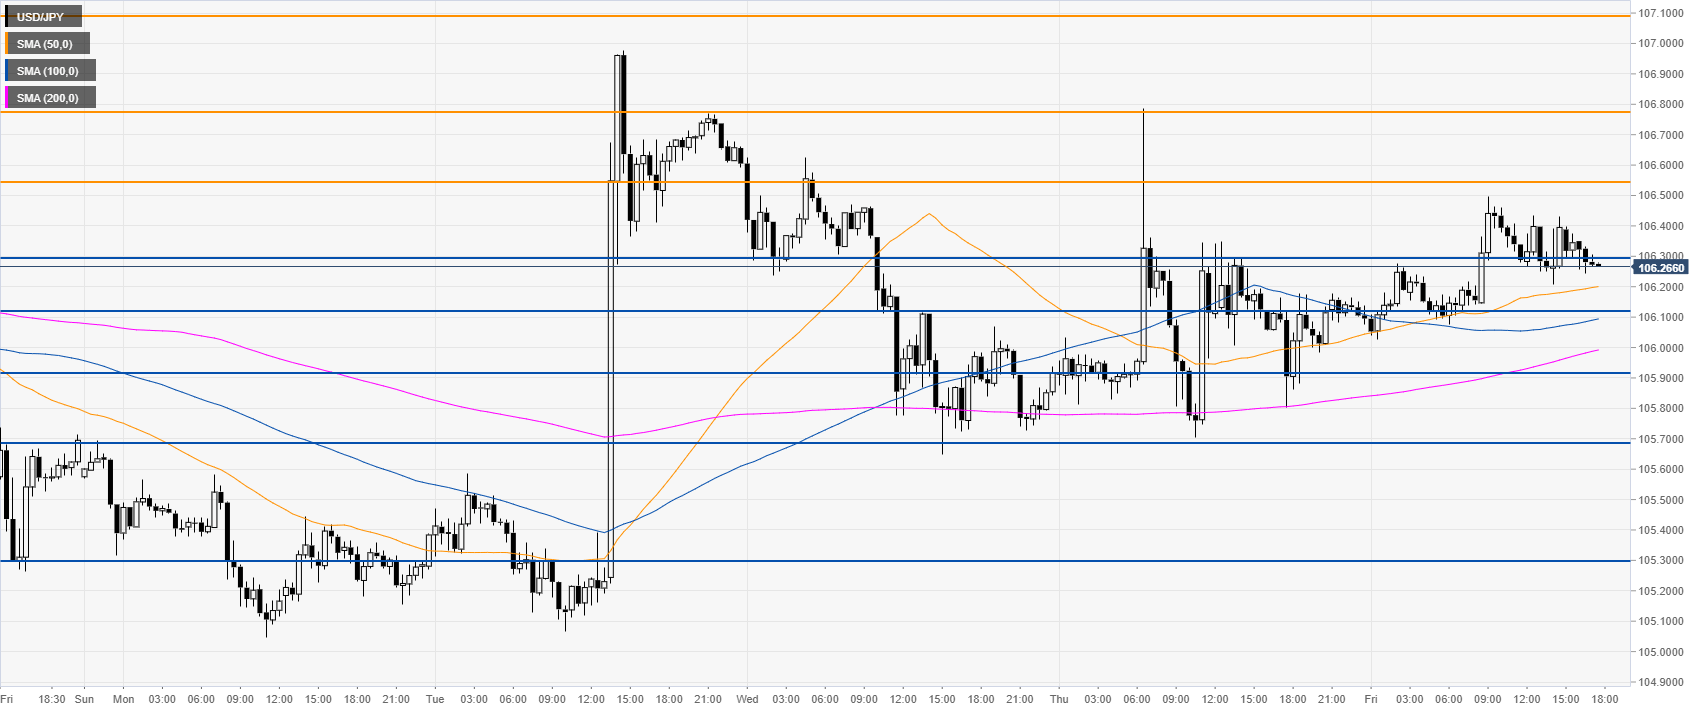
USD/JPY 30-minute chart

 
Dollar/Yen is trading its main SMAs as the market is consolidating Tuesday’s bullish move. There could be upside momentum next week. However, bulls have several layers of resistances to break at 106.30, 106.55 and 106.77 levels, according to the Technical Confluences Indicator. 


Additional key levels

USD/JPY

Overview
Today last price106.27
Today Daily Change0.16
Today Daily Change %0.15
Today daily open106.11
 
Trends
Daily SMA20107.2
Daily SMA50107.73
Daily SMA100109.17
Daily SMA200110.12
Levels
Previous Daily High106.78
Previous Daily Low105.7
Previous Weekly High107.09
Previous Weekly Low105.26
Previous Monthly High109.01
Previous Monthly Low107.21
Daily Fibonacci 38.2%106.37
Daily Fibonacci 61.8%106.12
Daily Pivot Point S1105.62
Daily Pivot Point S2105.12
Daily Pivot Point S3104.53
Daily Pivot Point R1106.7
Daily Pivot Point R2107.28
Daily Pivot Point R3107.78

Author

Flavio Tosti

Flavio Tosti

Independent Analyst


More from Flavio Tosti
Share:

Editor's Picks

EUR/USD flirts with daily highs, retargets 1.1900

EUR/USD regains upside traction, returning to the 1.1880 zone and refocusing its attention to the key 1.1900 barrier. The pair’s slight gains comes against the backdrop of a humble decline in the US Dollar as investors continue to assess the latest US CPI readings and the potential Fed’s rate path.

GBP/USD remains well bid around 1.3650

GBP/USD maintains its upside momentum in place, hovering around daily highs near 1.3650 and setting aside part of the recent three-day drop. Cable’s improved sentiment comes on the back of the Greenback’s  irresolute price action, while recent hawkish comments from the BoE’s Pill also collaborate with the uptick.

Gold clings to gains just above $5,000/oz

Gold is reclaiming part of the ground lost on Wednesday’s marked decline, as bargain-hunters keep piling up and lifting prices past the key $5,000 per troy ounce. The precious metal’s move higher is also underpinned by the slight pullback in the US Dollar and declining US Treasury yields across the curve.

Crypto Today: Bitcoin, Ethereum, XRP in choppy price action, weighed down by falling institutional interest 

Bitcoin's upside remains largely constrained amid weak technicals and declining institutional interest. Ethereum trades sideways above $1,900 support with the upside capped below $2,000 amid ETF outflows.

Week ahead – Data blitz, Fed Minutes and RBNZ decision in the spotlight

US GDP and PCE inflation are main highlights, plus the Fed minutes. UK and Japan have busy calendars too with focus on CPI. Flash PMIs for February will also be doing the rounds. RBNZ meets, is unlikely to follow RBA’s hawkish path.

Ripple Price Forecast: XRP potential bottom could be in sight

Ripple edges up above the intraday low of $1.35 at the time of writing on Friday amid mixed price actions across the crypto market. The remittance token failed to hold support at $1.40 the previous day, reflecting risk-off sentiment amid a decline in retail and institutional sentiment.