|

USD/JPY technical analysis: Greenback is challenging Tuesday's highs ahead of the FOMC Minutes

  • USD/JPY is trading at daily highs challenging the 107.40 resistance.
  • The FOMC Minutes are scheduled at 18:00 GMT; the news can lead to some volatility in USD-related currency pairs.
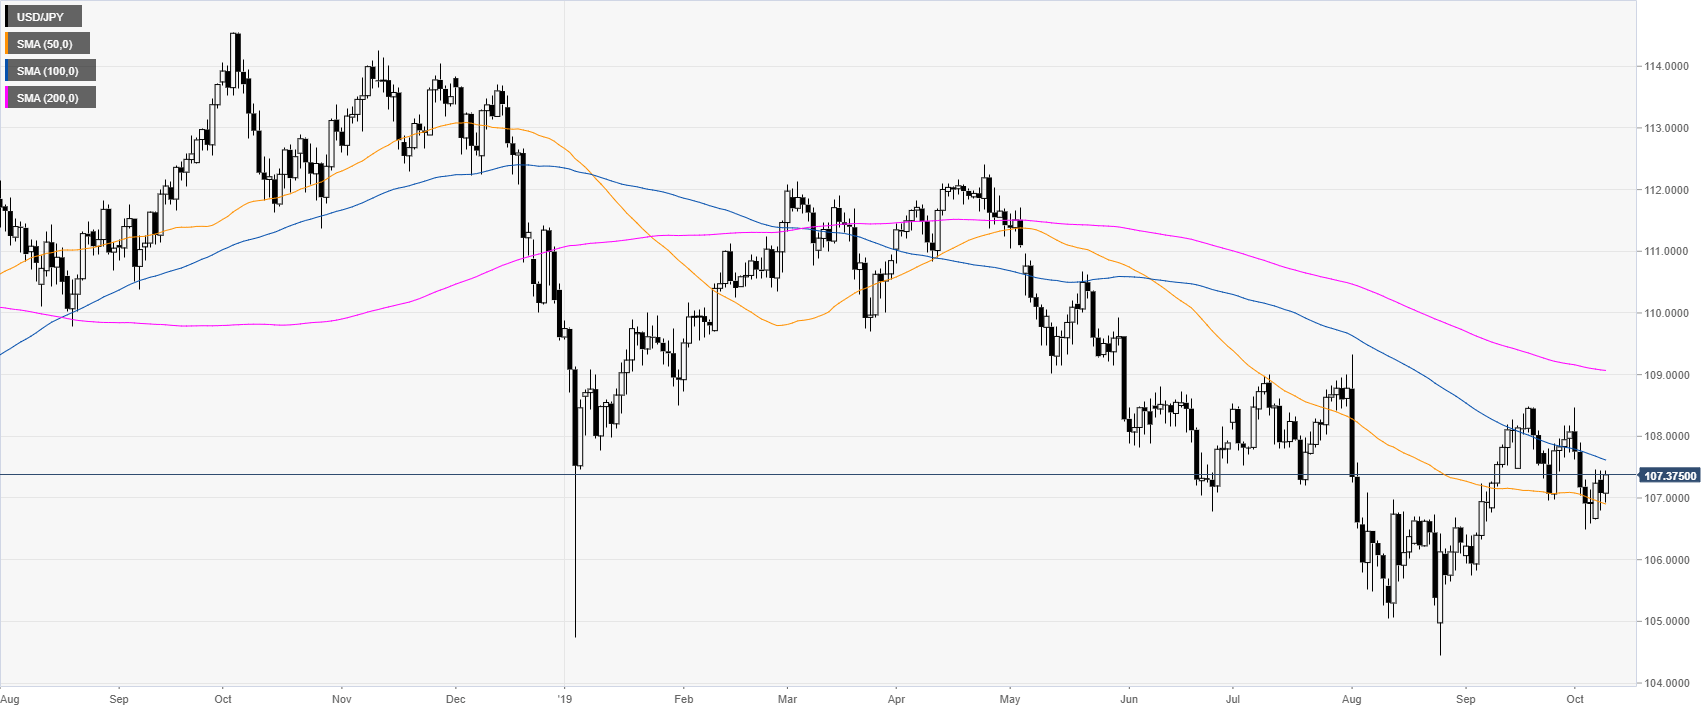
 

USD/JPY daily chart


USD/JPY is trading in a bear trend below the 100 and 200-day simple moving averages (DSMAs). However, the market is trying to find some support near the 50 SMA at the 106.90 level. The FOMC Minutes are scheduled at 18:00 GMT. The news can lead to some volatility in USD-related currency pairs.


USD/JPY four-hour chart


USD/JPY is challenging the 107.40 resistance and the 50 SMA on the four-hour chart. A break above the level can lead to the 107.70 resistance on the way up, according to the Technical Confluences Indicator.
 

USD/JPY 30-minute chart


The USD/JPY currency pair is trading above its main SMAs, suggesting bullish momentum in the near term. Immediate supports are seen at the 107.20 and 107.00 price levels, according to the Technical Confluences Indicator. 


Additional key levels

USD/JPY

Overview
Today last price107.36
Today Daily Change0.28
Today Daily Change %0.26
Today daily open107.08
 
Trends
Daily SMA20107.68
Daily SMA50106.93
Daily SMA100107.64
Daily SMA200109.08
 
Levels
Previous Daily High107.45
Previous Daily Low106.8
Previous Weekly High108.48
Previous Weekly Low106.48
Previous Monthly High108.48
Previous Monthly Low105.74
Daily Fibonacci 38.2%107.05
Daily Fibonacci 61.8%107.2
Daily Pivot Point S1106.78
Daily Pivot Point S2106.47
Daily Pivot Point S3106.13
Daily Pivot Point R1107.42
Daily Pivot Point R2107.75
Daily Pivot Point R3108.06

Author

Flavio Tosti

Flavio Tosti

Independent Analyst


More from Flavio Tosti
Share:

Editor's Picks

EUR/USD keeps the offered stance just above 1.1700

EUR/USD is coming under heavy selling pressure in what has been a rather grim start to the new trading week, with the pair now trading close to the 1.1700 support area as the US Dollar stages a solid rebound. The prevailing flight to safety mood continues to favour the Greenback, as investors react to the escalating conflict in the Middle East and trim risk exposure across the board.

GBP/USD hits new yearly lows near 1.3300

GBP/USD adds to the recent bearish tone, approaching to the key 1.3300 support to reach fresh YTD troughs against the backdrop of the robust performance of the US Dollar. Indeed, Cable’s decline comes amid the firm demand for the safe-haven space in the wake of the US and Israel attacks to Iran.

Gold trims losses, back below $5,400

Gold now surrenders part of the earlier advance past the $5,400 mark per troy ounce at the beginning of the week. Indeed, the precious metal’s strong uptick remains fuelled by increasing geopolitical tensions in the Middle East amid the intense demand for safer assets.

Bitcoin on brink of breakdown amid US-Iran war

Bitcoin (BTC) remains under pressure near the key support level of $65,700. Trading at $66,400 at the time of writing on Monday, a breakdown below this critical level would suggest a deeper correction ahead.

The Fed is finally talking about AI – Here's why it matters for the US Dollar

AI is moving from earnings calls into the heart of monetary policy discussions, forcing Federal Reserve officials to confront a new question: How to act if AI reshapes inflation, employment and interest rates at the same time?

Grass 20% bullish breakout defies broader market weakness

Grass (GRASS) is edging up above $0.30 at the time of writing on Monday. The token’s notable 20% intraday surge stands out amid heightened volatility in the broader crypto market.