|

USD/JPY technical analysis: Greenback extends losses against Yen, sub-107.40 level

  • The Greenback is on the back foot as the ADP came below forecast in the New York session.
  • The level to beat for sellers is the 107.00 support level.
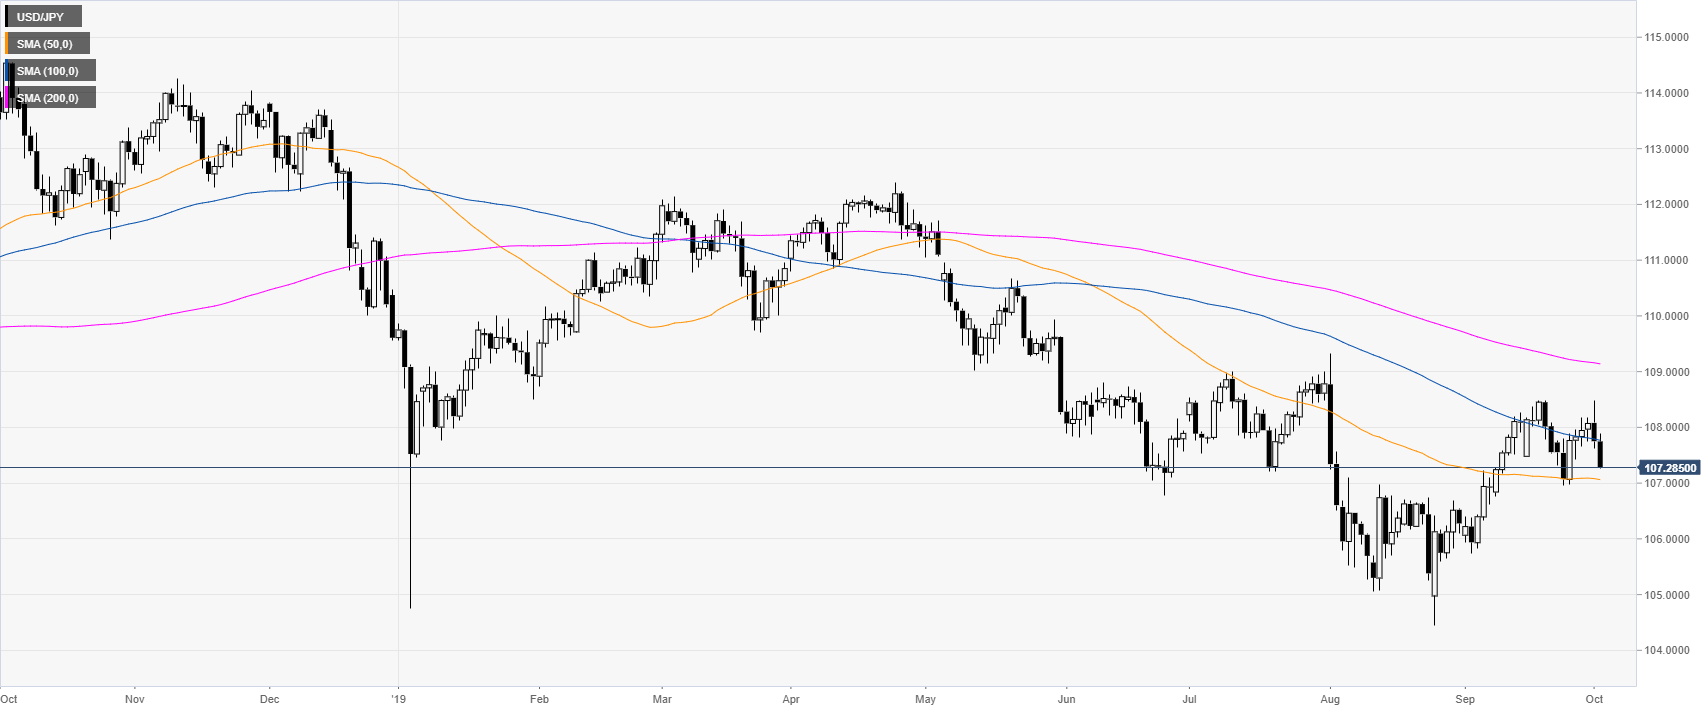
 

USD/JPY daily chart


The USD/JPY currency pair is in a downtrend below the 100 and 200-day simple moving averages (SMAs). The spot is trading below the September highs and the 108.00 handle. This Wednesday, the ADP, the forerunner of the Nonfarm Payrolls on Friday, disappointed the market with only 135k vs. 140k expected in September. 


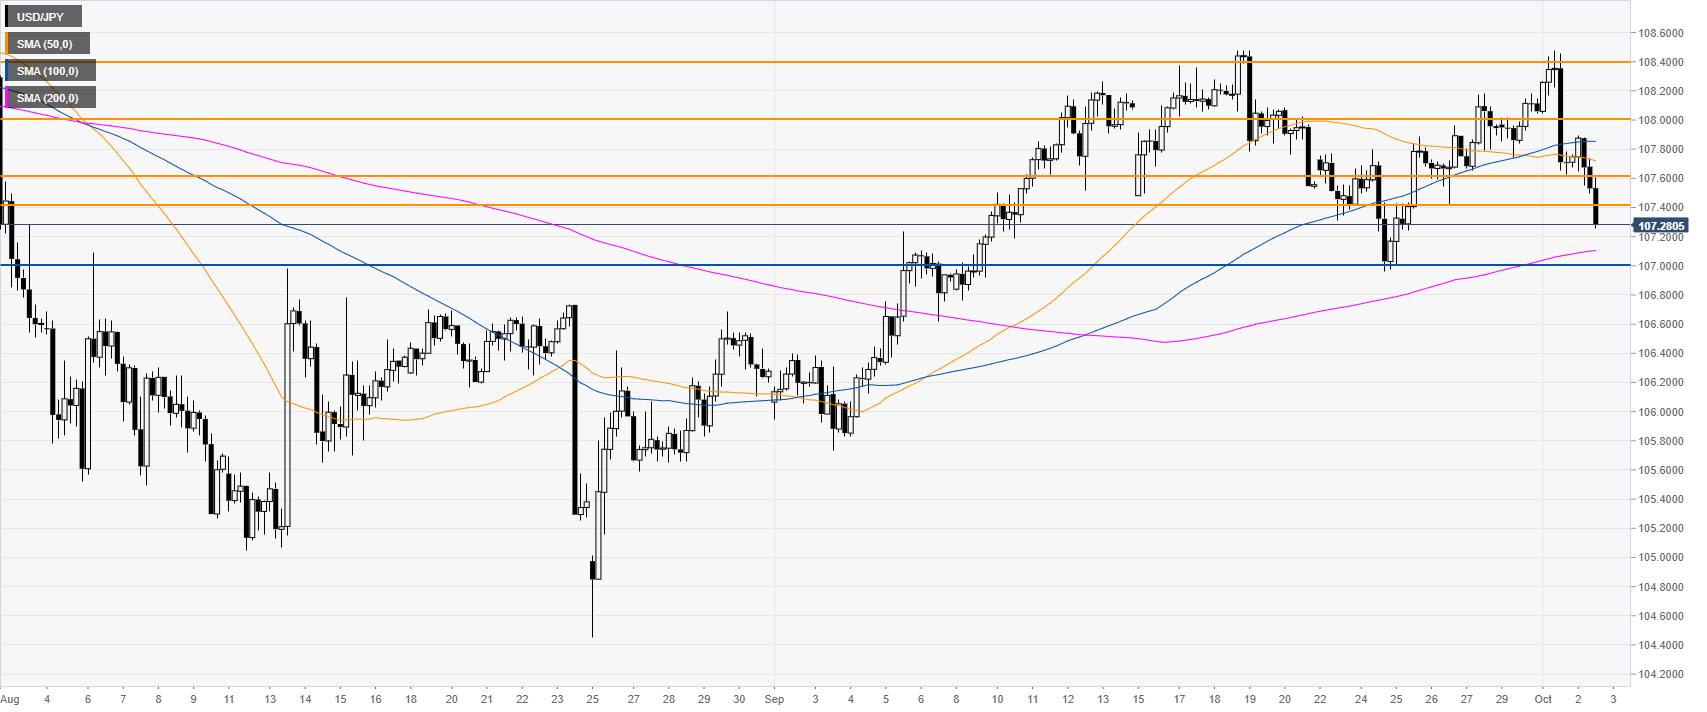
USD/JPY four-hour chart


USD/JPY is under pressure below the 108.40 level and the 50/100 SMAs. The break of 107.40 can expose the 107.00 support level to the downside, according to the Technical Confluences Indicator
 

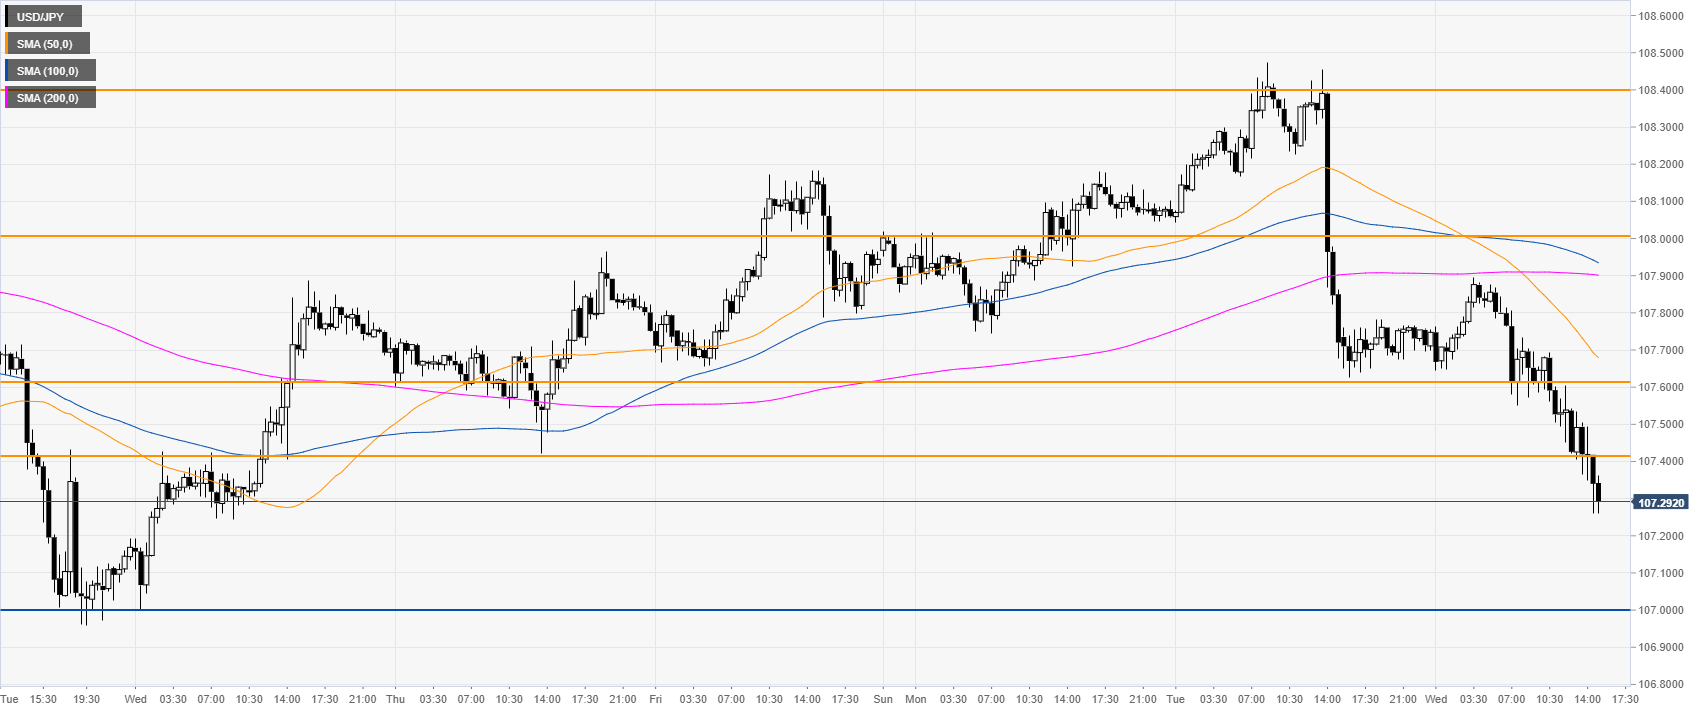
USD/JPY 30-minute chart


USD/JPY is under pressure below the main SMAs, suggesting a bearish bias in the near term. Immediate resistances are seen at the 107.40 and 107.60 price levels, according to the Technical Confluences Indicator. 


Additional key levels

USD/INR

Overview
Today last price71.2152
Today Daily Change0.1045
Today Daily Change %0.15
Today daily open71.1107
 
Trends
Daily SMA2071.2885
Daily SMA5071.0087
Daily SMA10070.1369
Daily SMA20070.1355
 
Levels
Previous Daily High71.242
Previous Daily Low70.6425
Previous Weekly High71.37
Previous Weekly Low70.3685
Previous Monthly High72.6325
Previous Monthly Low70.3685
Daily Fibonacci 38.2%71.013
Daily Fibonacci 61.8%70.8715
Daily Pivot Point S170.7548
Daily Pivot Point S270.3989
Daily Pivot Point S370.1553
Daily Pivot Point R171.3543
Daily Pivot Point R271.5979
Daily Pivot Point R371.9538

Author

Flavio Tosti

Flavio Tosti

Independent Analyst


More from Flavio Tosti
Share:

Editor's Picks

EUR/USD flirts with daily highs, retargets 1.1900

EUR/USD regains upside traction, returning to the 1.1880 zone and refocusing its attention to the key 1.1900 barrier. The pair’s slight gains comes against the backdrop of a humble decline in the US Dollar as investors continue to assess the latest US CPI readings and the potential Fed’s rate path.

GBP/USD remains well bid around 1.3650

GBP/USD maintains its upside momentum in place, hovering around daily highs near 1.3650 and setting aside part of the recent three-day drop. Cable’s improved sentiment comes on the back of the Greenback’s  irresolute price action, while recent hawkish comments from the BoE’s Pill also collaborate with the uptick.

Gold holds above $5,000 as bears seem hesitant amid Fed rate cut bets

Gold edges lower at the start of a new week, though it defends the $5,000 psychological mark through the Asian session. The underlying bullish sentiment is seen acting as a headwind for the bullion. However, bets for more rate cuts by the Fed, bolstered by Friday's softer US CPI, keep the US Dollar bulls on the defensive and continue to support the non-yielding yellow metal as the focus now shifts to FOMC Minutes on Wednesday.

Week ahead: Data blitz, Fed Minutes and RBNZ decision in the spotlight

The US jobs report for January, which was delayed slightly, didn’t do the dovish Fed bets any favours, as expectations of a soft print did not materialize, confounding the raft of weak job indicators seen in the prior week.

Global inflation watch: Signs of cooling services inflation

Realized inflation landed close to expectations in January, as negative base effects weighed on the annual rates. Remaining sticky inflation is largely explained by services, while tariff-driven goods inflation remains limited even in the US.

Ripple Price Forecast: XRP potential bottom could be in sight

Ripple edges up above the intraday low of $1.35 at the time of writing on Friday amid mixed price actions across the crypto market. The remittance token failed to hold support at $1.40 the previous day, reflecting risk-off sentiment amid a decline in retail and institutional sentiment.