|

USD/JPY technical analysis: Greenback clings to weekly highs near 107.90 level

  • USD/JPY holds onto weekly gains as the market is nearing the 107.90 resistance.
  • The levels to beat for bulls is the 107.90/108.13 resistance zone.
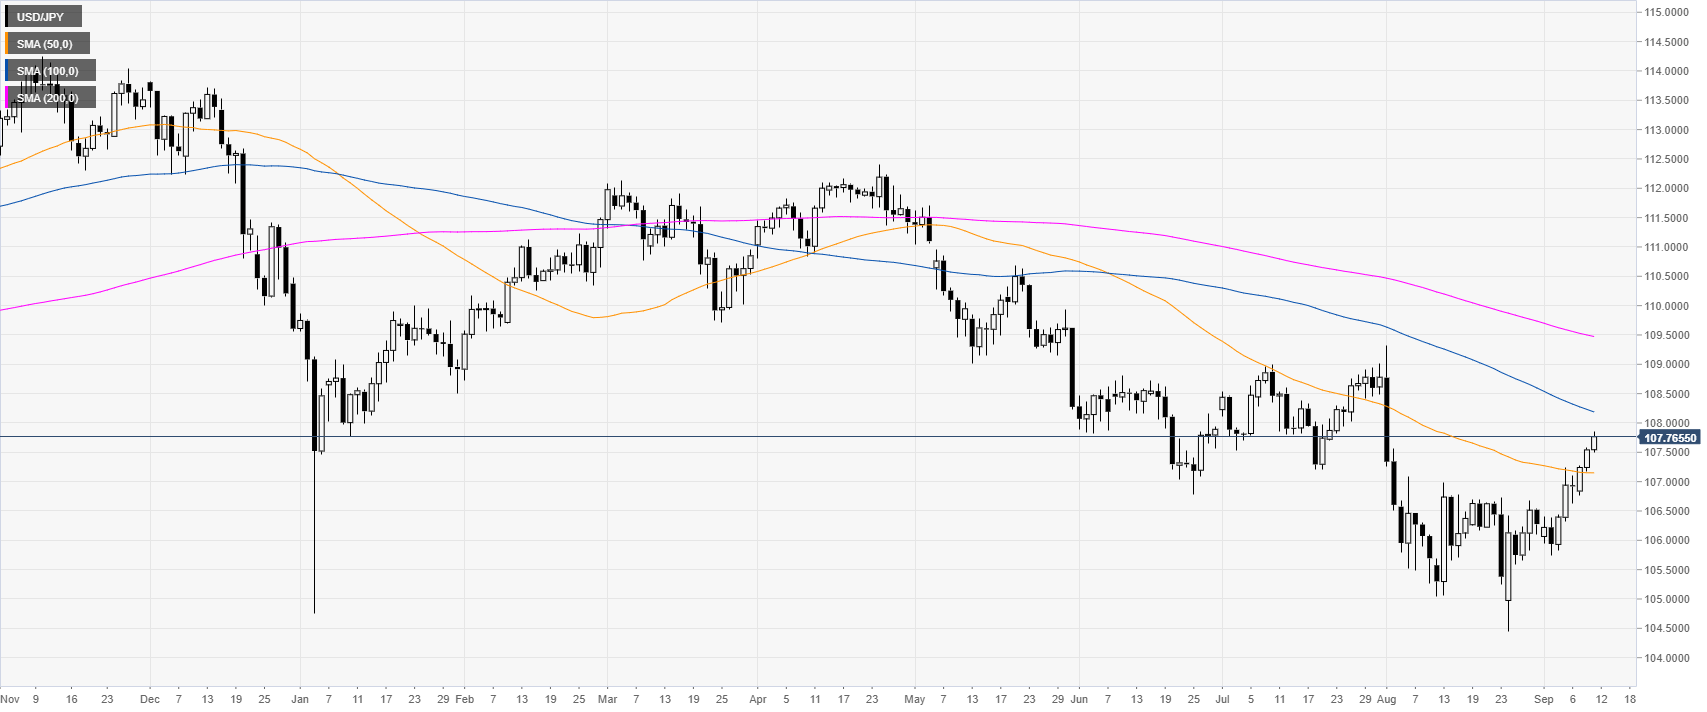


USD/JPY daily chart


USD/JPY is trading in a bear trend below the 100 and 200-day simple moving averages (DSMAs). The market broke above the 107.00 figure and the 50 SMA. 


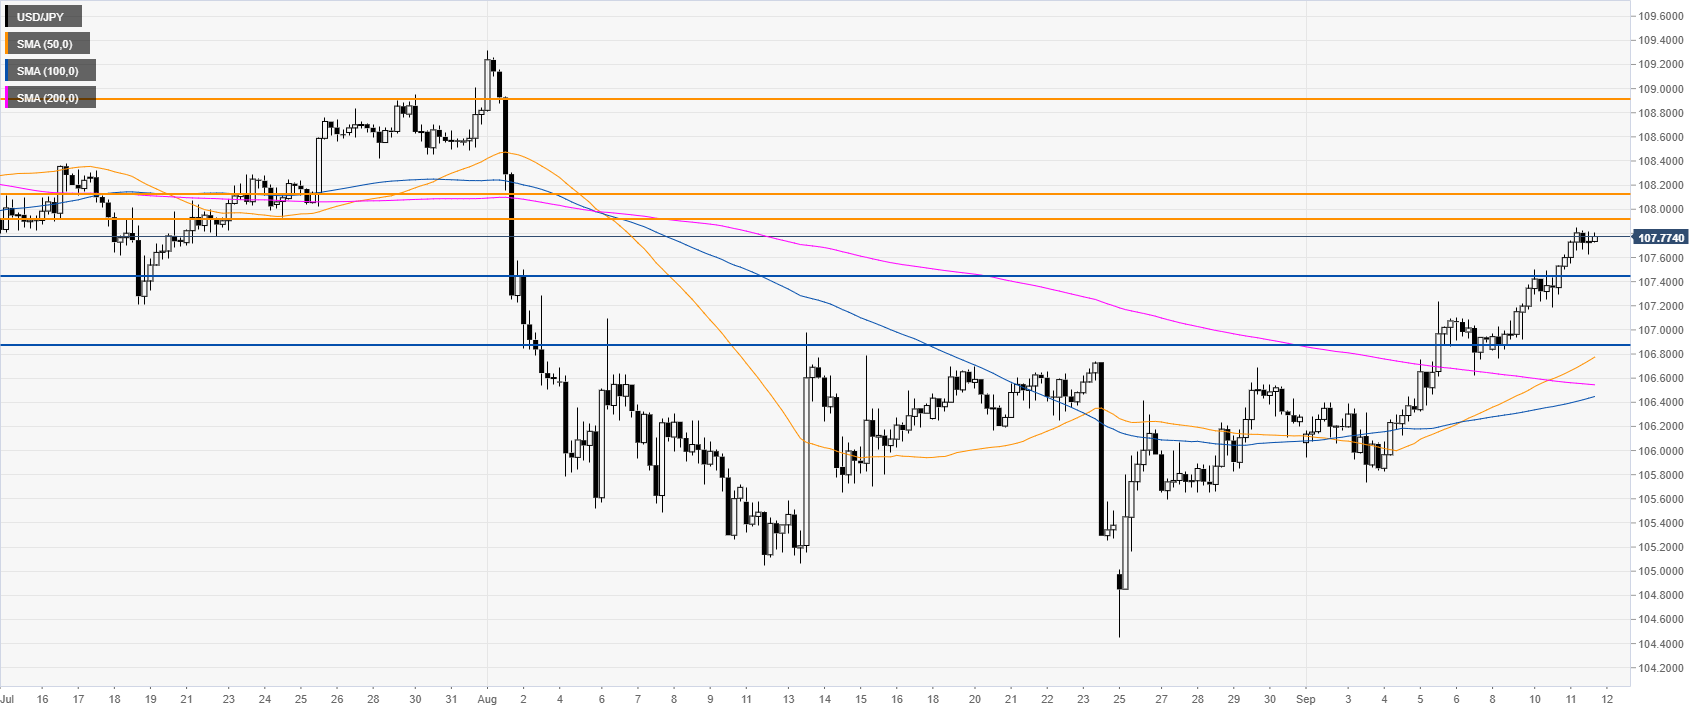
USD/JPY 4-hour chart


USD/JPY is trading above its main SMAs, suggesting bullish momentum in the medium term. Bulls will be looking for a break beyond the 107.90/108.13 resistance zone in order to set their eyes on the 108.92 resistance level, according to the Technical Confluences Indicator


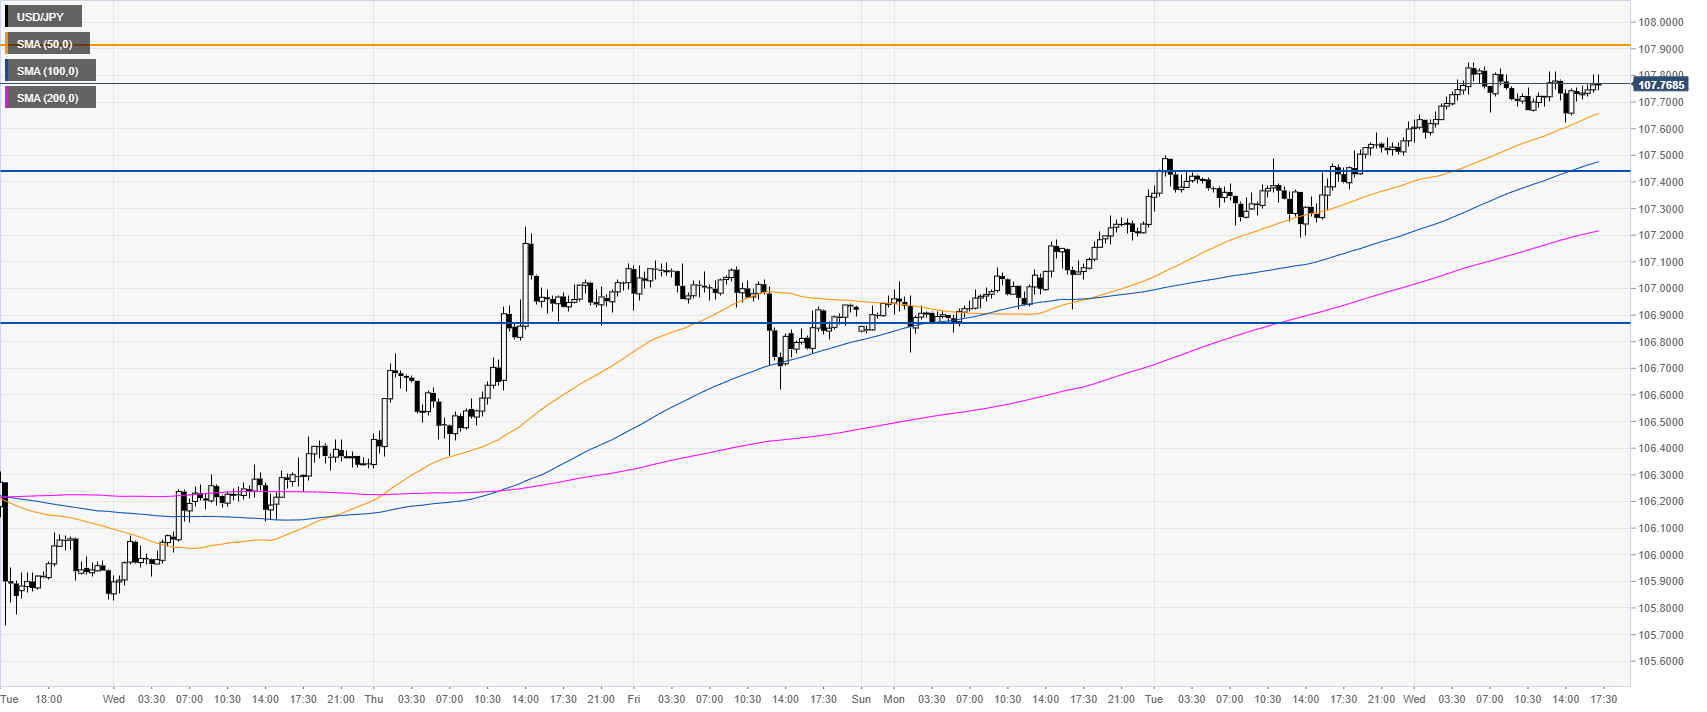
USD/JPY 30-minute chart


Dollar/Yen is trading above the main SMAs, suggesting bullish momentum in the near term. Immediate support is seen at 107.42 level followed by the 106.90  level, according to the Technical Confluences Indicator. 
 

Additional key levels

USD/JPY

Overview
Today last price107.76
Today Daily Change0.22
Today Daily Change %0.20
Today daily open107.54
 
Trends
Daily SMA20106.38
Daily SMA50107.15
Daily SMA100108.23
Daily SMA200109.5
Levels
Previous Daily High107.59
Previous Daily Low107.18
Previous Weekly High107.23
Previous Weekly Low105.74
Previous Monthly High109.32
Previous Monthly Low104.45
Daily Fibonacci 38.2%107.43
Daily Fibonacci 61.8%107.34
Daily Pivot Point S1107.28
Daily Pivot Point S2107.03
Daily Pivot Point S3106.88
Daily Pivot Point R1107.69
Daily Pivot Point R2107.84
Daily Pivot Point R3108.1

Author

Flavio Tosti

Flavio Tosti

Independent Analyst


More from Flavio Tosti
Share:

Editor's Picks

EUR/USD faces some resistance near 100-SMA on H4, around 1.1830 zone

The EUR/USD pair gains some follow-through positive traction for the second consecutive day and climbs to the 1.1830 region during the Asian session on Thursday. The US Dollar remains on the back foot amid concerns about the economic fallout from US President Donald Trump's erratic trade policies and acts as a tailwind for spot prices.

GBP/USD extends recovery to near 20-day EMA as US Dollar weakens

The Pound Sterling holds onto weekly gains around 1.3565 against the US Dollar during the Asian trading session on Thursday. The GBP/USD pair trades firmly as the US Dollar remains under pressure due to uncertainty surrounding the United States trade policy outlook.

Gold struggle with $5,200 extends ahead of more US-Iran talks

Gold is replicating the recovery moves seen in Wednesday’s Asian trading early Thursday, as buyers continue to flirt with the $5,200 level. Sustained US Dollar weakness and looming US-Iran talks aid the bright metal’s rebound.  

Stellar: Relief bounce fades as bearish undertone persists

Stellar is trading around $0.16 at the time of writing on Thursday after rebounding more than 8% in the previous day. Derivatives data paints a negative picture as XLM’s short bets hit a monthly high while Open Interest continues to decline.

Nvidia delivers another monster earnings report, and forecasts big things to come

It was another monster earnings report from Nvidia for fiscal Q4. Revenues were $68.1bn, smashing estimates of $65bn. Gross profit margin was a healthy 75%, up from 73.5% in the prior quarter, and the outlook for this quarter was monstrous.

Cosmos Hub Price Forecast: ATOM rebounds slightly, bearish outlook remains intact

Cosmos Hub (ATOM) price rebounds, trading above $2.05 at the time of writing on Wednesday, after undergoing a sharp correction since last week. Weakening on-chain and derivatives data support a bearish outlook, while technical analysis remains unfavorable.