|

USD/JPY Technical Analysis: Greenback clings to daily gains near the 109.00 handle

  • USD/JPY is holding near daily highs as the London session is about to come to an end. 
  • Resistance on the way up is seen at 109.46 and 109.92/110.00 price zone. 
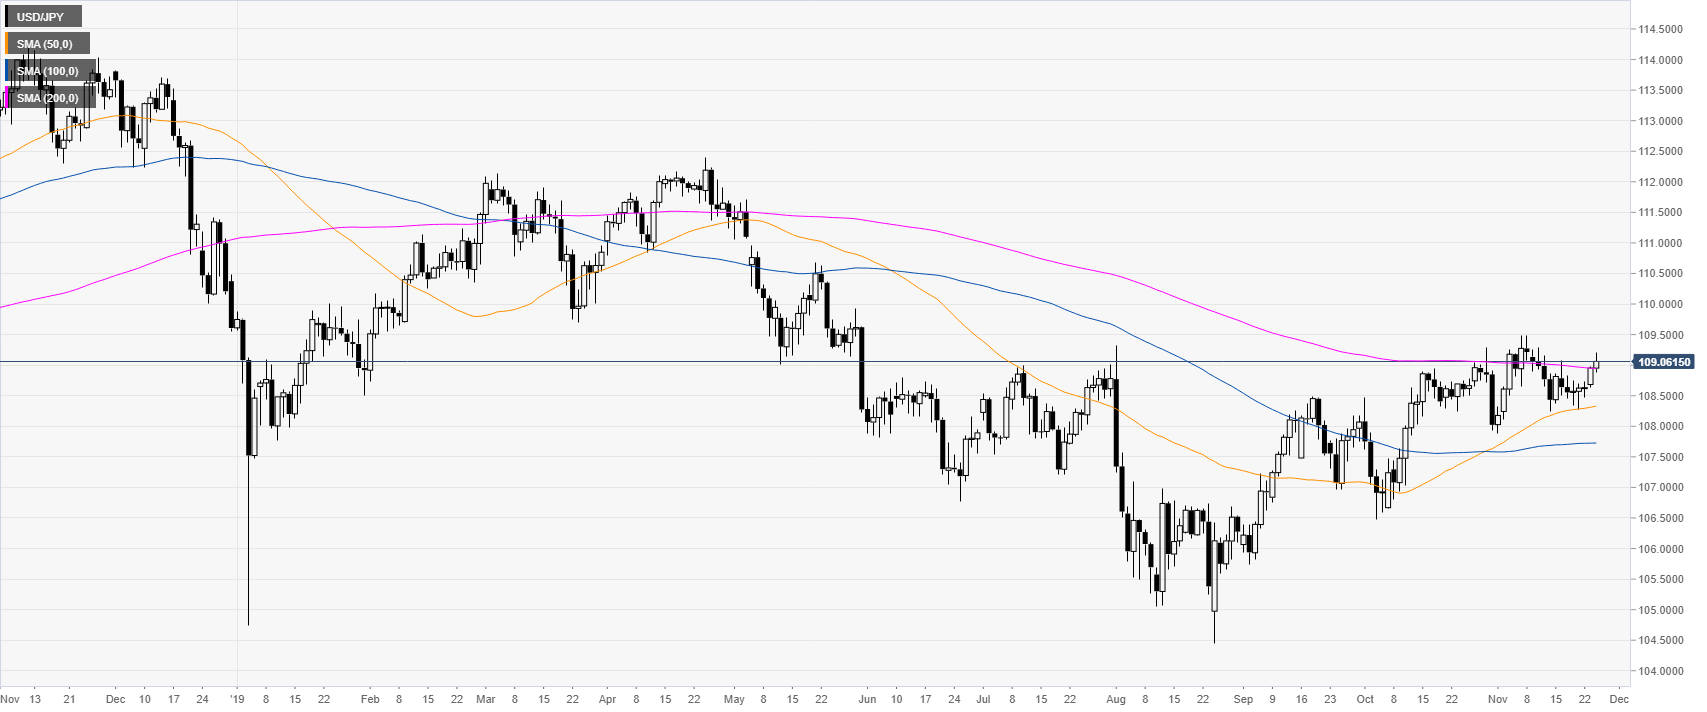
 

USD/JPY daily chart

 
USD/JPY is trading just above the 109.00 handle and the 200-day simple moving average (DMA) on the daily time frame. In the last three months, the spot has been gaining momentum. 
 

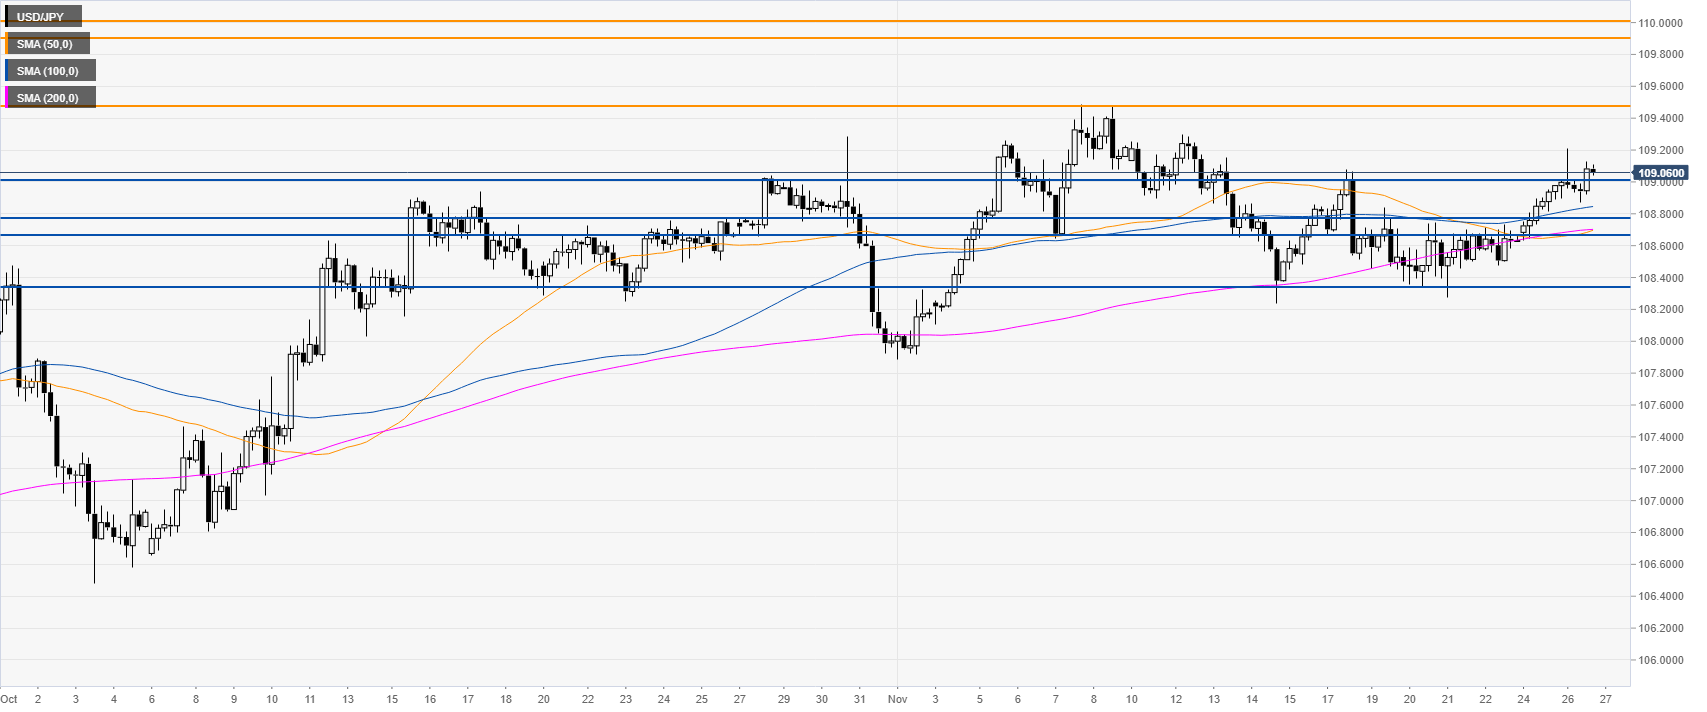
USD/JPY four-hour chart

 
USD/JPY is holding above the 109.01 support level while trading above the main SMAs. As the market is gaining strength, the spot could be traveling towards the 109.46 level and the 109.92/110.00 resistance zone, according to the Technical Confluences Indicator.
  

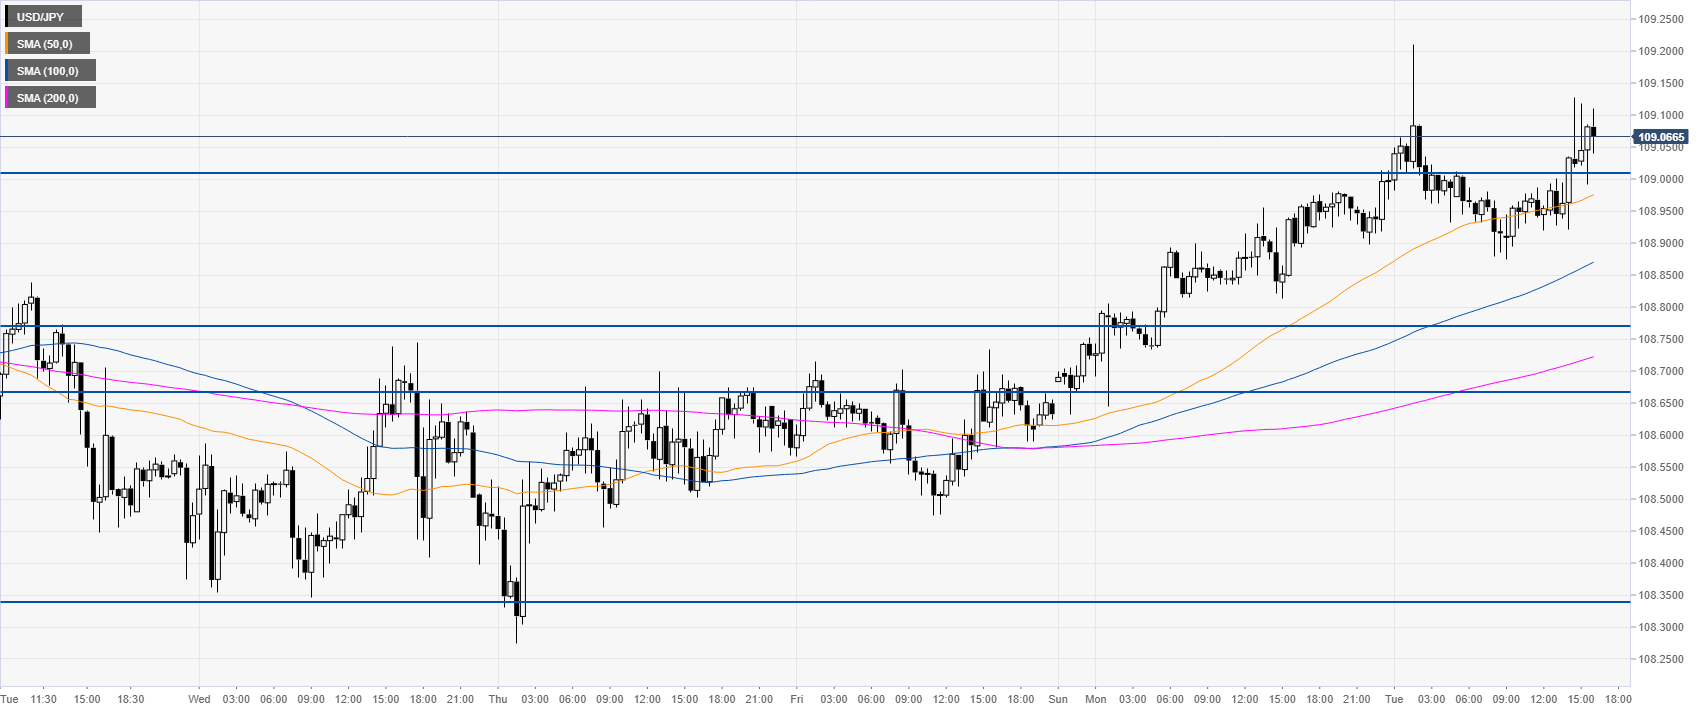
USD/JPY 30-minute chart

 
USD/JPY is trading above the main SMAs on the 30-minute chart. Support is seen at 109.01, the 108.66/78 zone and 108.33 level, according to the Technical Confluences Indicator.
  

Additional key levels

USD/JPY

Overview
Today last price109.09
Today Daily Change0.14
Today Daily Change %0.13
Today daily open108.95
 
Trends
Daily SMA20108.76
Daily SMA50108.31
Daily SMA100107.72
Daily SMA200108.95
 
Levels
Previous Daily High108.98
Previous Daily Low108.63
Previous Weekly High109.08
Previous Weekly Low108.28
Previous Monthly High109.29
Previous Monthly Low106.48
Daily Fibonacci 38.2%108.85
Daily Fibonacci 61.8%108.77
Daily Pivot Point S1108.73
Daily Pivot Point S2108.51
Daily Pivot Point S3108.38
Daily Pivot Point R1109.08
Daily Pivot Point R2109.2
Daily Pivot Point R3109.43

Author

Flavio Tosti

Flavio Tosti

Independent Analyst


More from Flavio Tosti
Share:

Editor's Picks

EUR/USD faces some resistance near 100-SMA on H4, around 1.1830 zone

The EUR/USD pair gains some follow-through positive traction for the second consecutive day and climbs to the 1.1830 region during the Asian session on Thursday. The US Dollar remains on the back foot amid concerns about the economic fallout from US President Donald Trump's erratic trade policies and acts as a tailwind for spot prices.

GBP/USD extends recovery to near 20-day EMA as US Dollar weakens

The Pound Sterling holds onto weekly gains around 1.3565 against the US Dollar during the Asian trading session on Thursday. The GBP/USD pair trades firmly as the US Dollar remains under pressure due to uncertainty surrounding the United States trade policy outlook.

Gold struggle with $5,200 extends ahead of more US-Iran talks

Gold is replicating the recovery moves seen in Wednesday’s Asian trading early Thursday, as buyers continue to flirt with the $5,200 level. Sustained US Dollar weakness and looming US-Iran talks aid the bright metal’s rebound.  

Top Crypto Gainers: Polkadot, Near Protocol, Uniswap lead market rebound

Altcoins, such as Polkadot, Near Protocol, and Uniswap, are leading gains over the last 24 hours as Bitcoin jumped 6% on Wednesday. The altcoins are holding steady at press time on Thursday following a rebound the previous day, testing the waters around their 50-day Exponential Moving Average. 

Nvidia delivers another monster earnings report, and forecasts big things to come

It was another monster earnings report from Nvidia for fiscal Q4. Revenues were $68.1bn, smashing estimates of $65bn. Gross profit margin was a healthy 75%, up from 73.5% in the prior quarter, and the outlook for this quarter was monstrous.

Cosmos Hub Price Forecast: ATOM rebounds slightly, bearish outlook remains intact

Cosmos Hub (ATOM) price rebounds, trading above $2.05 at the time of writing on Wednesday, after undergoing a sharp correction since last week. Weakening on-chain and derivatives data support a bearish outlook, while technical analysis remains unfavorable.