USD/JPY technical analysis: Flashing red, but bounce likely in next 24 hours
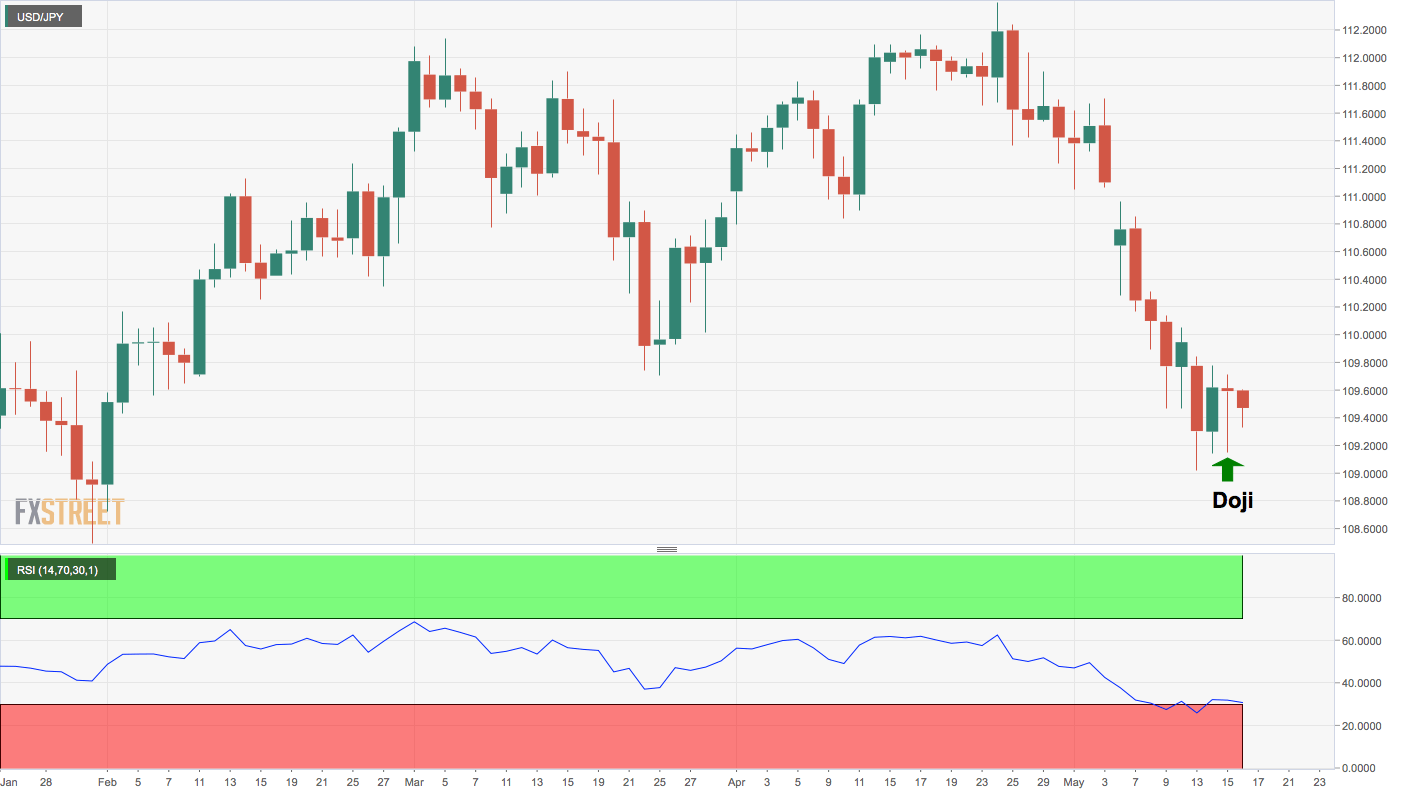
- USD/JPY created doji candle on Wednesday.
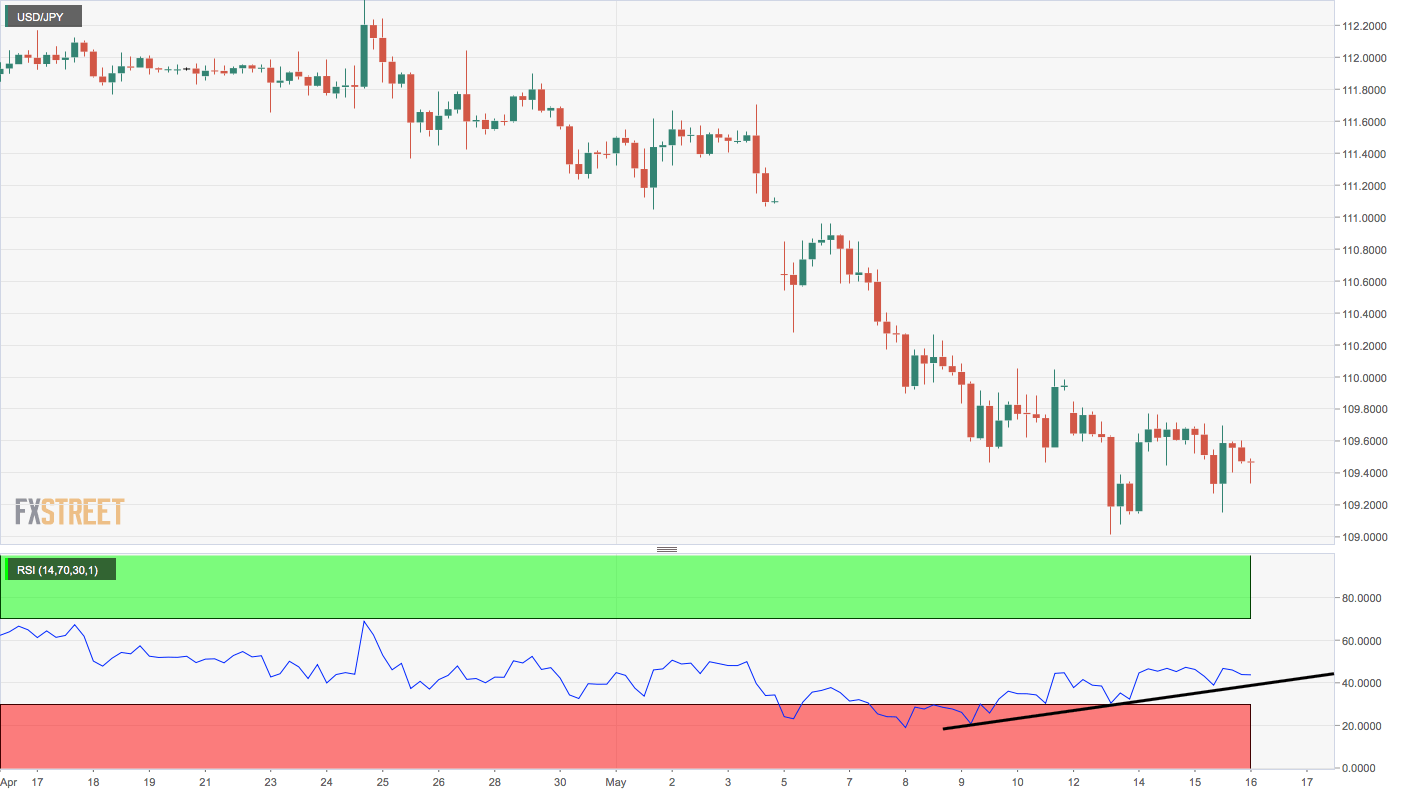
- The 4-hour chart shows a bullish divergence of RSI.

USD/JPY is currently trading at 0.16% on the day at 109.42, but may soon pick up a bid and rise toward 110.00 over the next 24 hours as technical charts are flashing signs of seller exhaustion.
To start with, the pair created a classic long-legged doji candle on Wednesday, a sign of indecision among the sellers. After all, the candle has appeared following a sell-off from 112.40 to 109.02.
Further, on the 4-hour chart, the relative strength index (RSI) has diverged in favor of the bulls.
As a result, a corrective bounce to 10-day moving average, currently at 109.98 looks likely.
Daily chart
4-hour chart
Trend: Bullish
Pivot points
Author

Omkar Godbole
FXStreet Contributor
Omkar Godbole, editor and analyst, joined FXStreet after four years as a research analyst at several Indian brokerage companies.


