USD/JPY Technical Analysis: Early Friday dip into 112.80 on Yen buying
- The Dollar-Yen pairing took a quick dip into 112.82 in thin Asian markets as the JPY sees a quick round of bidding up, though with Japanese markets shuttered for the national holiday, the buying pressure on the Yen is unlikely to evolve into a meaningful trend change.
- The down move in the USD/JPY is already getting worked back, with the pair getting bounced back from the quick sell-off.

USD/JPY Chart, 5-Minute
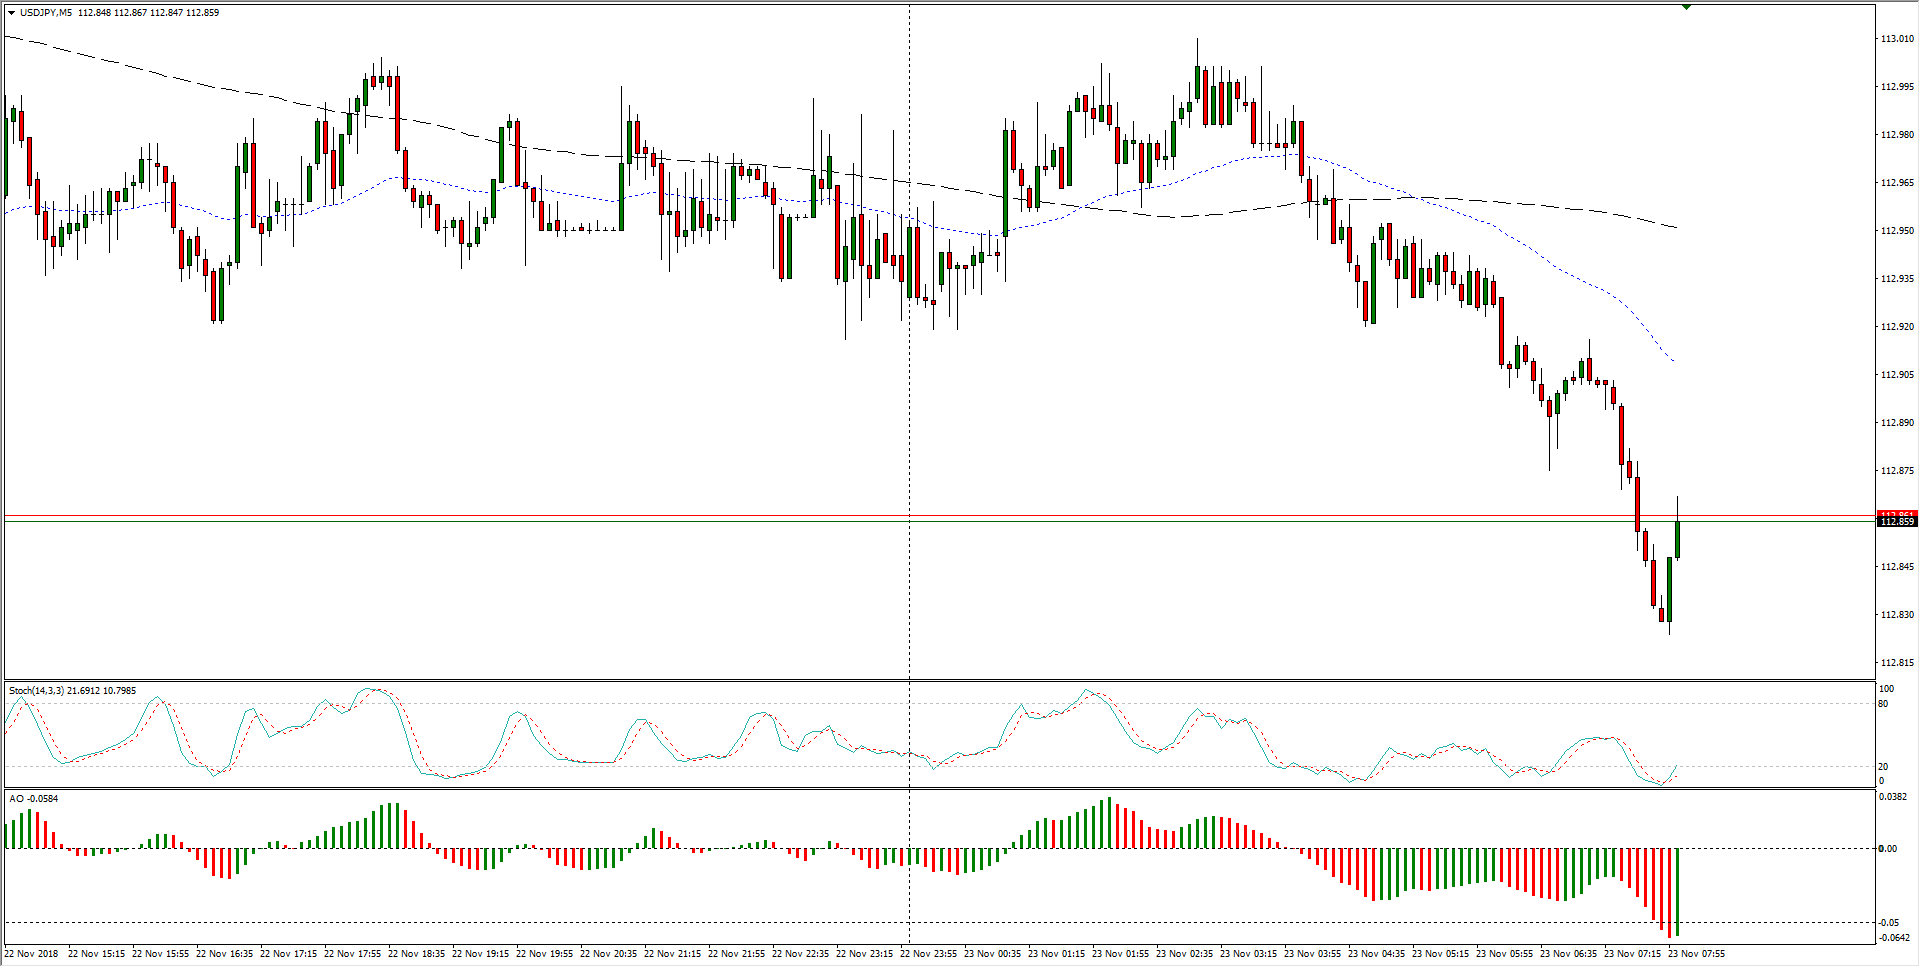
- The USD/JPY has seen downside play over the past two weeks, and the 113.00 technical level is the current near-term ceiling on action.
USD/JPY Chart, 30-Minute
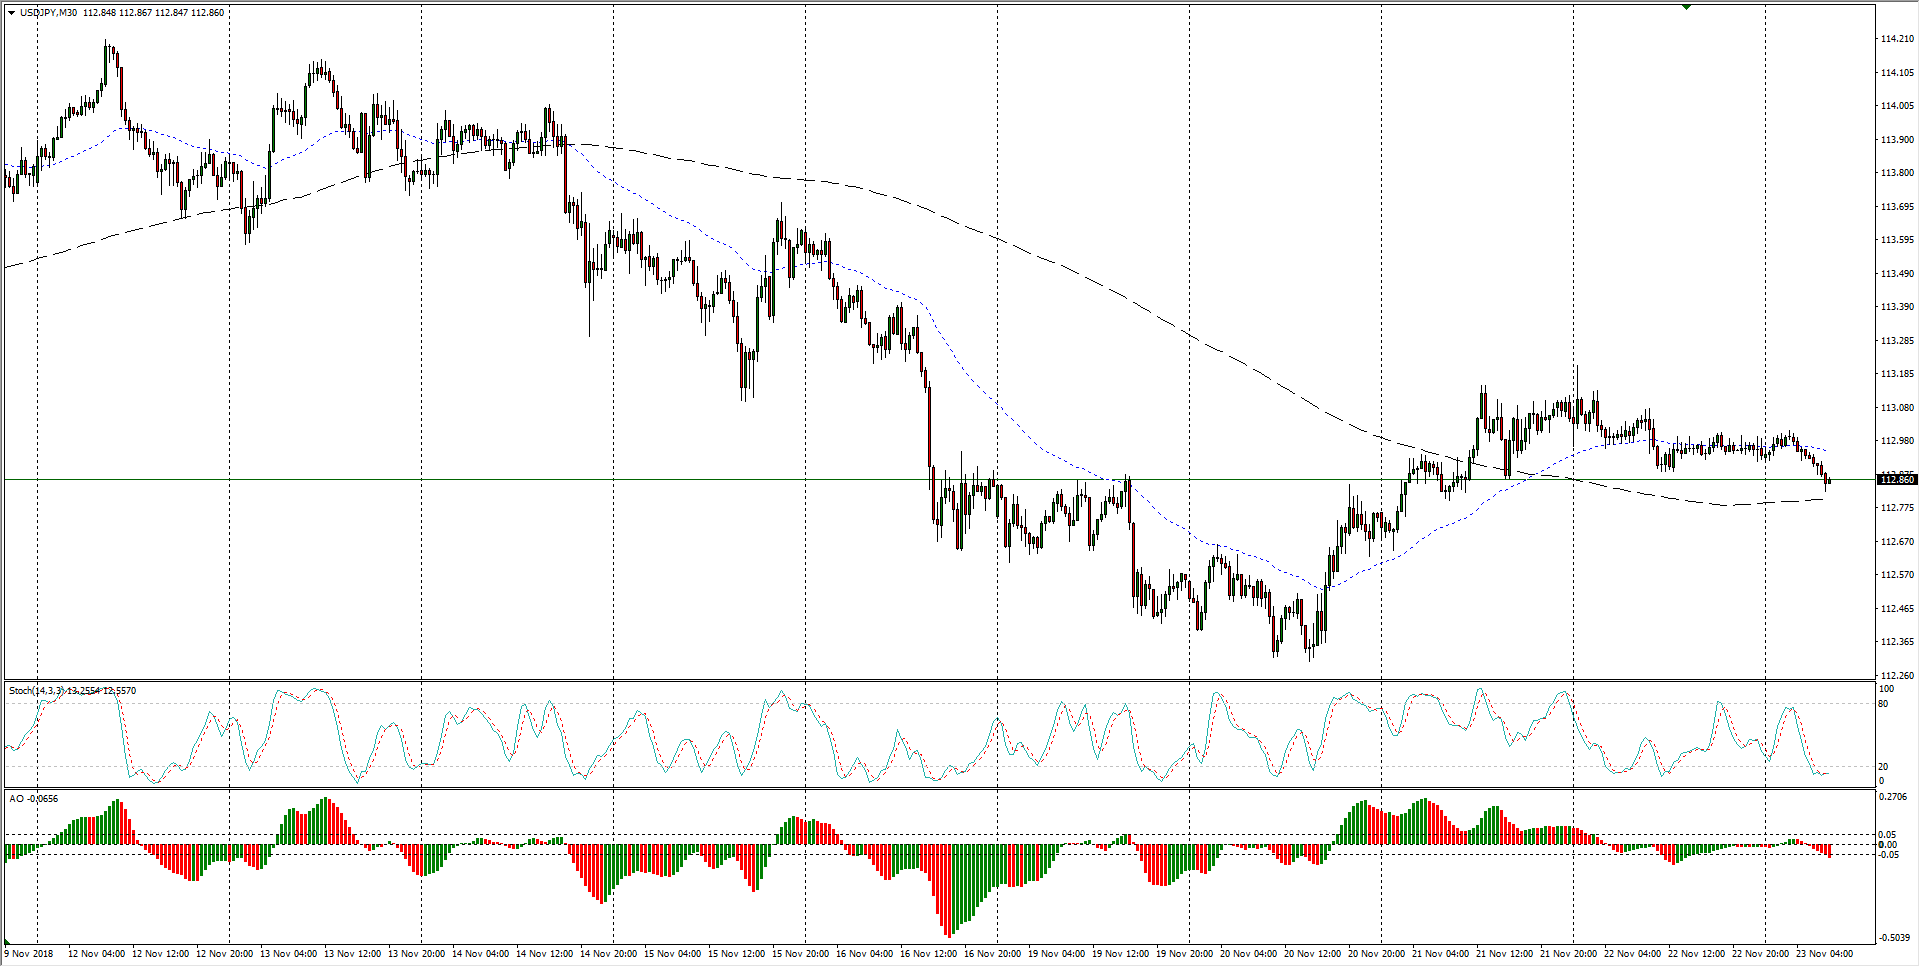
- The past four months see the USD/JPY beginning to wrap itself around the 200-period moving average, and this week's lower high into 113.20 increases the odds of a new shortside pattern beginning to develop.
USD/JPY Chart, 4-Hour

USD/JPY
Overview:
Last Price: 112.85
Daily change: -11 pips
Daily change: -0.0974%
Daily Open: 112.96
Trends:
Daily SMA20: 113.14
Daily SMA50: 112.92
Daily SMA100: 112.12
Daily SMA200: 110.23
Levels:
Daily High: 113.24
Daily Low: 112.88
Weekly High: 114.22
Weekly Low: 112.64
Monthly High: 114.56
Monthly Low: 111.38
Daily Fibonacci 38.2%: 113.01
Daily Fibonacci 61.8%: 113.1
Daily Pivot Point S1: 112.81
Daily Pivot Point S2: 112.66
Daily Pivot Point S3: 112.44
Daily Pivot Point R1: 113.17
Daily Pivot Point R2: 113.39
Daily Pivot Point R3: 113.54
Author

Joshua Gibson
FXStreet
Joshua joins the FXStreet team as an Economics and Finance double major from Vancouver Island University with twelve years' experience as an independent trader focusing on technical analysis.


