|
USD/JPY technical analysis: Contracting triangle breakout may pave way for 110.00
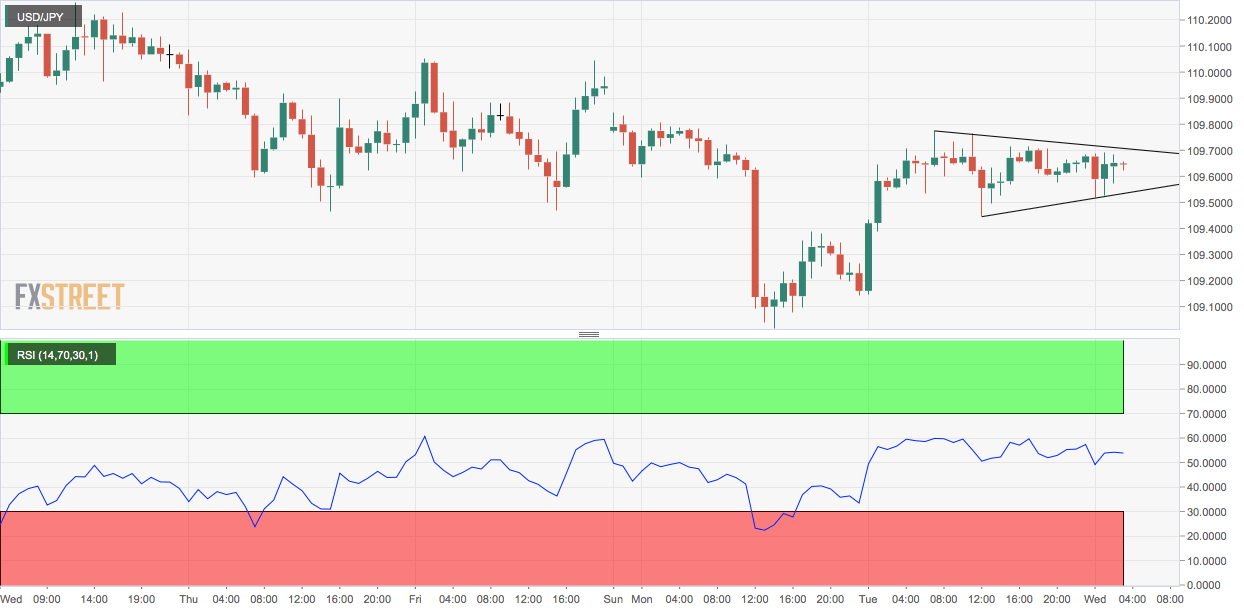
- USD/JPY has charted a contracting triangle on the hourly chart.
- Triangle breakout would signal a continuation of the recovery from recent lows near 109.00.

USD/JPY pair has created a contracting triangle on the hourly chart.
A move above 109.68 would confirm triangle breakout or resumption of the corrective bounce from the recent low of 109.02 and allow a test of supply around the psychological resistance of 110.00.
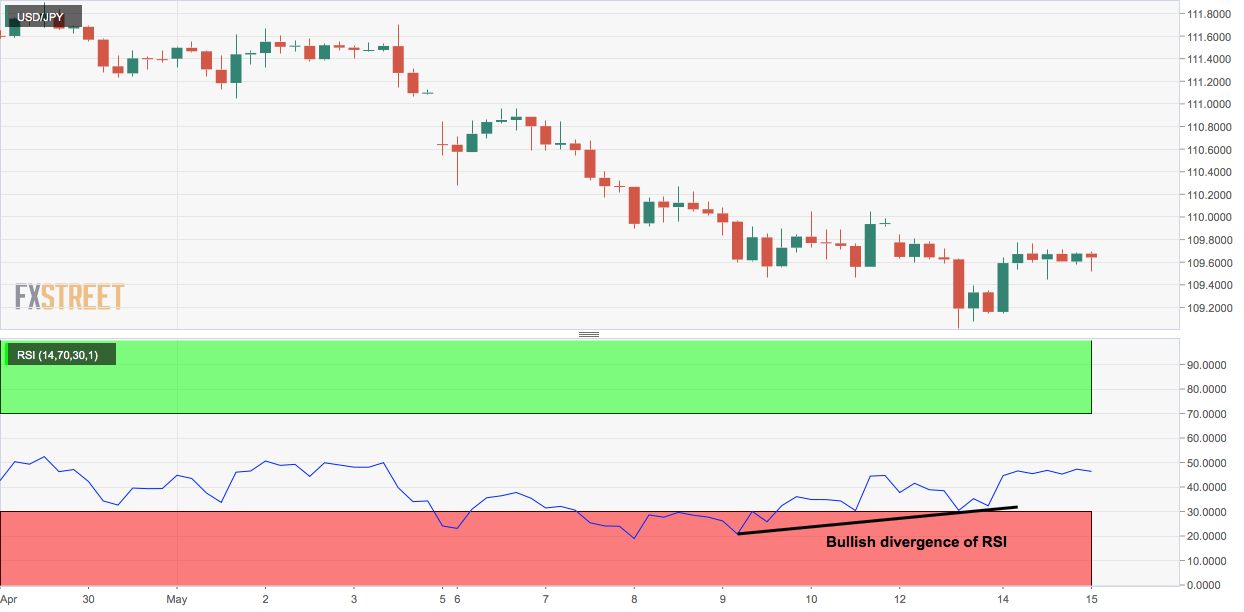
The bullish divergence of the 4-hour chart relative strength index (RSI) also indicates scope for a rise to 110.00.
The bullish case, however, would weaken if the contracting triangle is breached to the downside. That, however, looks unlikely with the equities flashing green.
Hourly chart
4-hour chart
Trend: Bullish
Pivot points
Author

Omkar Godbole
FXStreet Contributor
Omkar Godbole, editor and analyst, joined FXStreet after four years as a research analyst at several Indian brokerage companies.
More from Omkar Godbole


