|
USD/JPY Technical Analysis: challenging 6-day long ascending trendline
- The USD/JPY pair is flirting with the support of the trendline sloping upwards from September 6. A break lower would validate the bearish divergence of the relative strength index (RSI) and allow a deeper pullback to the 200-hour moving average (MA), currently located at 111.17.
- On the higher side, a convincing move above the previous week's high of 111.76 will likely confirm a bull breakout and open the doors to re-test of the 200-week MA of 113.26.

Hourly Chart
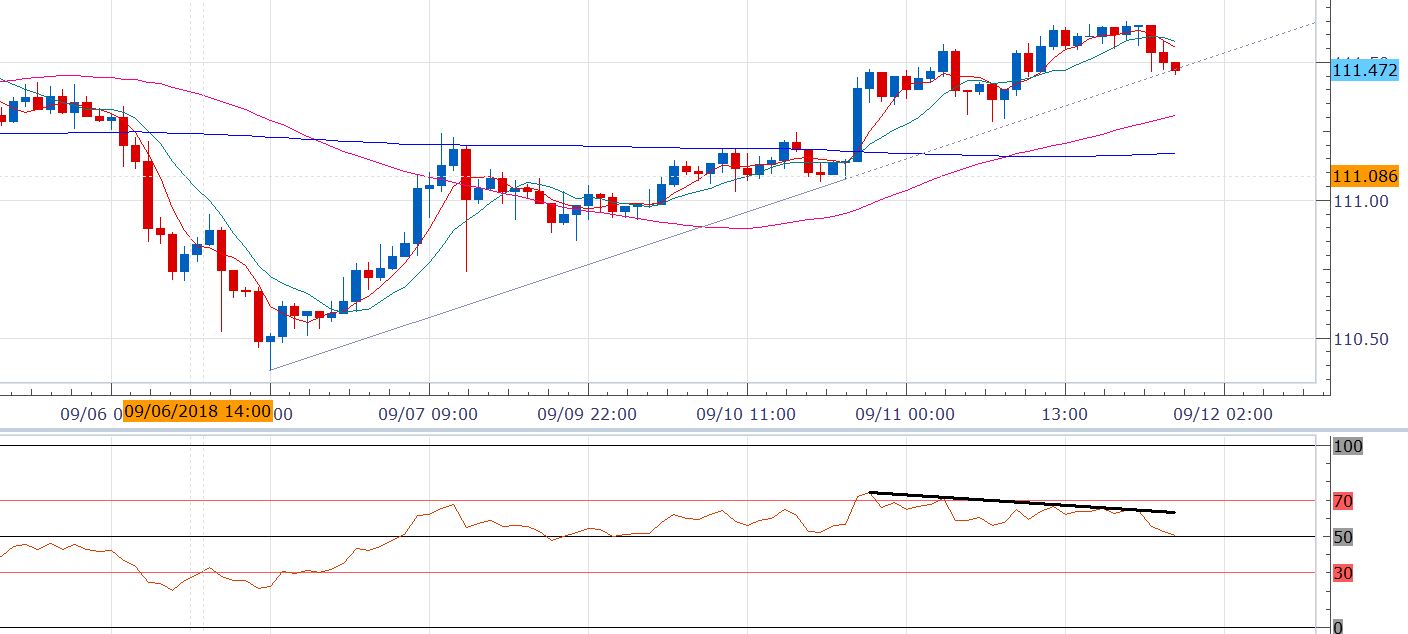
Spot Rate: 111.47
Daily High: 111.65
Daily Low: 111.45
Trend: Intraday bearish
R1: 111.65 (session high)
R2: 111.83 (Aug. 29 high)
R3: 112.15 (Aug. 1 high)
Support
S1: 111.47 (rising trendline support on the hourly chart)
S2: 111.31 (50-hour MA)
S3: 111.17 (200-hour MA)
Author

Omkar Godbole
FXStreet Contributor
Omkar Godbole, editor and analyst, joined FXStreet after four years as a research analyst at several Indian brokerage companies.
More from Omkar Godbole


