USD/JPY technical analysis: Buyers will look for a decisive break of 109.00
- USD/JPY stays positive beyond 50% Fibonacci retracement.
- Bullish MACD, repeated attempts to clear key resistance highlight the strength of buying momentum.

With its sustained trading beyond 50% Fibonacci retracement of April-August downpour, USD/JPY again confronts 200-day EMA while taking rounds to 108.75 during early Monday.
Not only frequent pullbacks from the key Fibonacci retracement level but bullish signal by 12-bar Moving Average Convergence and Divergence (MACD) indicator also portrays strength in underlying momentum.
As a result, a daily closing beyond the 200-day Exponential Moving Average (EMA) level of 108.75 will not be enough to lure bulls as they will wait for confirmation above monthly top near 109.00.
In doing so, August month top and 61.8% Fibonacci retracement level close to 109.35/40 will be their first target while looking at the 110.00 round-figure.
On the downside, pair’s daily closing below 50% Fibonacci retracement level of 108.40 can drag the quote to the two-month-old rising trend line, around 107.70, a break of which will be the key to watch sellers aiming at monthly bottom around 106.50.
USD/JPY daily chart
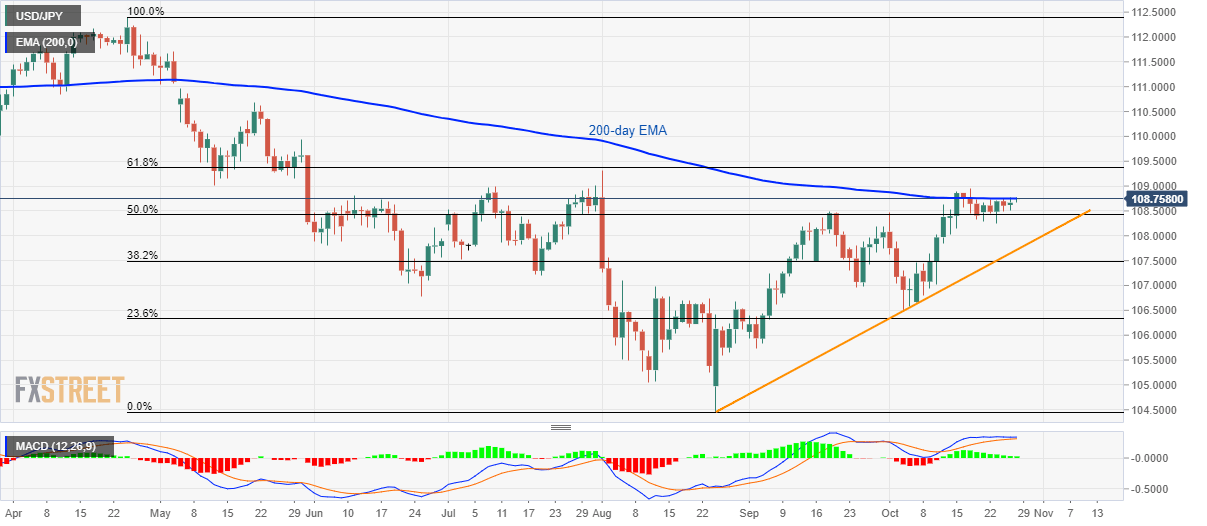
Trend: bullish
Author

Anil Panchal
FXStreet
Anil Panchal has nearly 15 years of experience in tracking financial markets. With a keen interest in macroeconomics, Anil aptly tracks global news/updates and stays well-informed about the global financial moves and their implications.


