USD/JPY Technical Analysis: Bounce from 200-hour EMA could fade below 113.45
- USD/JPY is currently trading at 113.47, having defended the support of the 200-hour exponential moving average (EMA) on Friday.
- The rebound, however, could run out of steam if the spot fails to defend a key support at 113.45 - lower edge of the rising wedge, as seen in the 15-minute chart. A rising wedge breakdown, if confirmed, would confirm a bearish reversal on 15-minute chart and open the doors to re-test of the 200-hour EMA, currently at 113.28.
- As seen in the 15-minute chart, the RSI has already bearish the ascending trendline in favor of the bears. So, the pair is more likely to suffer a rising wedge breakdown.

15-minute chart
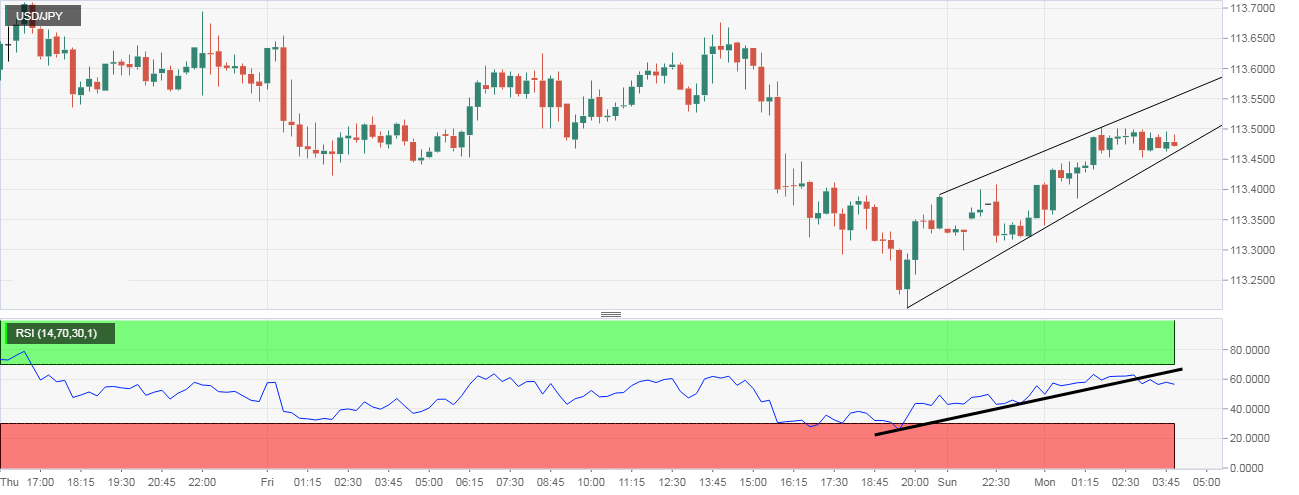
Trend: Bearish
USD/JPY
Overview:
Today Last Price: 113.48
Today Daily change: 9.0 pips
Today Daily change %: 0.0794%
Today Daily Open: 113.39
Trends:
Previous Daily SMA20: 113.2
Previous Daily SMA50: 113
Previous Daily SMA100: 112.37
Previous Daily SMA200: 110.76
Levels:
Previous Daily High: 113.7
Previous Daily Low: 113.2
Previous Weekly High: 113.71
Previous Weekly Low: 112.24
Previous Monthly High: 114.25
Previous Monthly Low: 112.3
Previous Daily Fibonacci 38.2%: 113.39
Previous Daily Fibonacci 61.8%: 113.51
Previous Daily Pivot Point S1: 113.16
Previous Daily Pivot Point S2: 112.94
Previous Daily Pivot Point S3: 112.67
Previous Daily Pivot Point R1: 113.65
Previous Daily Pivot Point R2: 113.92
Previous Daily Pivot Point R3: 114.14
Author

Omkar Godbole
FXStreet Contributor
Omkar Godbole, editor and analyst, joined FXStreet after four years as a research analyst at several Indian brokerage companies.


