USD/JPY struggles amid trade tensions, pair capped below key moving averages


USD/JPY price analysis: Dollar struggles amid trade tensions, pair capped below key moving averages

  • USD/JPY trades around the 143 zone during Wednesday's North American session
  • US tariffs, weaker yields, and trade risks weigh on the Dollar's broader outlook
  • Technical resistance seen near 145.50–145.80 zone, while 142.40 offers key support

The USD/JPY pair holds a modest upside bias during Wednesday’s North American session, hovering around the 143 handle. Despite the intraday uptick, the broader tone remains cautious as the US Dollar stays under pressure in the face of escalating trade tensions and falling Treasury yields. The Japanese Yen, typically a safe haven during geopolitical flare-ups, has struggled to capitalize fully amid crosswinds in equity markets and monetary divergence.

On the fundamental front, market sentiment has turned fragile following US President Donald Trump’s decision to explore new tariffs on critical mineral imports. These proposed levies come atop already substantial reciprocal tariffs in the ongoing US-China trade standoff. Meanwhile, China responded with rare earth export restrictions, raising concerns about supply chain disruptions in key industries such as technology and defense. Though both sides have shown openness to resume negotiations, rhetoric from Beijing emphasized the need for mutual respect.

While US economic data has been relatively firm—March Retail Sales rose 1.4%, slightly above expectations—investors continue to divest from the Greenback, reflecting broader anxiety around global trade and monetary policy. The US Dollar Index slipped further on the day, undermining USD/JPY’s ability to extend gains.
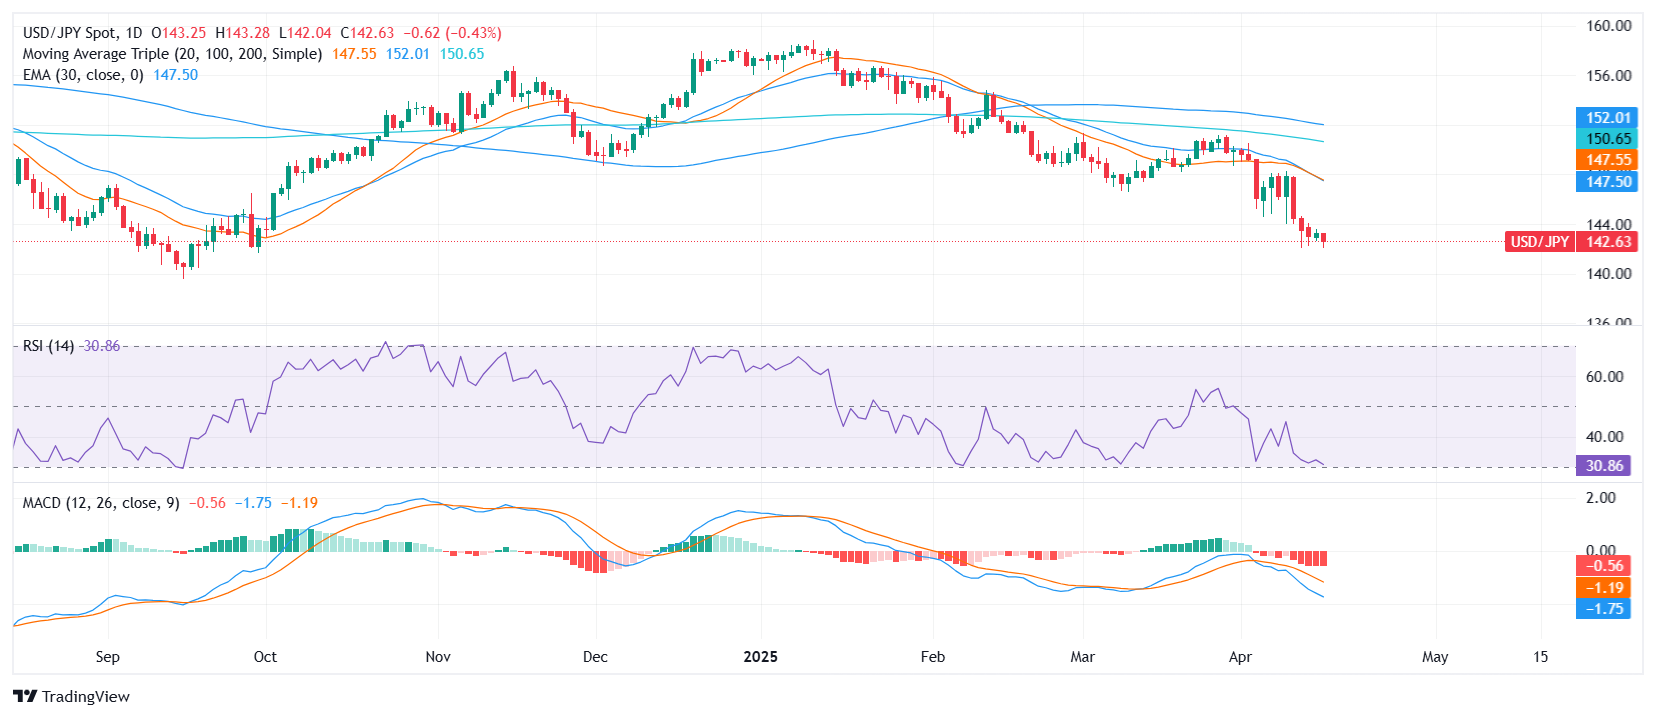
Technical Analysis


From a technical perspective, the USD/JPY pair is showing a mixed picture. The Moving Average Convergence Divergence (MACD) is flashing a sell signal, suggesting weakening momentum. Meanwhile, the Relative Strength Index (RSI) stands near 32, indicating the pair is nearing oversold territory. The 20-, 100-, and 200-day Simple Moving Averages all point to further downside, reinforcing the broader bearish outlook. The Williams Percent Range signals a potential bounce, but other indicators remain neutral.

Key support is seen around 142.41, with further downside targets at 141.80. On the upside, resistance lies at 145.47, followed by 145.79 and 146.62. Unless bulls manage to break decisively above the confluence of moving averages, upside attempts may continue to face headwinds.


Share: Feed news

Information on these pages contains forward-looking statements that involve risks and uncertainties. Markets and instruments profiled on this page are for informational purposes only and should not in any way come across as a recommendation to buy or sell in these assets. You should do your own thorough research before making any investment decisions. FXStreet does not in any way guarantee that this information is free from mistakes, errors, or material misstatements. It also does not guarantee that this information is of a timely nature. Investing in Open Markets involves a great deal of risk, including the loss of all or a portion of your investment, as well as emotional distress. All risks, losses and costs associated with investing, including total loss of principal, are your responsibility. The views and opinions expressed in this article are those of the authors and do not necessarily reflect the official policy or position of FXStreet nor its advertisers. The author will not be held responsible for information that is found at the end of links posted on this page.

If not otherwise explicitly mentioned in the body of the article, at the time of writing, the author has no position in any stock mentioned in this article and no business relationship with any company mentioned. The author has not received compensation for writing this article, other than from FXStreet.

FXStreet and the author do not provide personalized recommendations. The author makes no representations as to the accuracy, completeness, or suitability of this information. FXStreet and the author will not be liable for any errors, omissions or any losses, injuries or damages arising from this information and its display or use. Errors and omissions excepted.

The author and FXStreet are not registered investment advisors and nothing in this article is intended to be investment advice.

Recommended content


Recommended content

Editors’ Picks

AUD/USD: Consolidation seems the name of the game

AUD/USD: Consolidation seems the name of the game

AUD/USD came under further downside pressure on Thursday, adding to Wednesday’s retracement and briefly dipping below the key support at 0.6400 the figure. The pair’s pullback came despite decent losses in the Greenback and firmer Australian labour market report.

EUR/USD: Door open to further weakness

EUR/USD: Door open to further weakness

EUR/USD is starting to feel heavy, with growing concern that more downside could be just around the corner. The pair has struggled to hold onto any bullish momentum and has been steadily drifting lower since hitting yearly highs near 1.1570 in late April.

Gold hovers around $3,200 amid tepid buying

Gold hovers around $3,200 amid tepid buying

Gold kept up its bullish momentum on Thursday, climbing to fresh daily highs above the key $3,200 mark per troy ounce. The move is getting a boost from a softer Greenback and a generally cautious mood in global markets, while the initial excitement around the US–China trade deal continues to fade.

Crypto Today: SOL, XRP and ADA in danger zone as Bitcoin price anchors market above $3.4 trillion

Crypto Today: SOL, XRP and ADA in danger zone as Bitcoin price anchors market above $3.4 trillion

The cryptocurrency sector declined 4% on Thursday, with aggregate market capitalization hovering precariously above the $3.4 trillion mark. Top altcoins XRP, Solana and Cardano booked losses higher than the market average, with the more resilient performance of BTC and ETH signaled a flight-to-quality trade. 

Why the UK’s first quarter growth surge looks strange

Why the UK’s first quarter growth surge looks strange

The UK economy roared back to life in the first quarter after stagnating through the second half of last year. Or did it? We're not sure the data is an accurate guide to what's going on beneath the surface.

The Best brokers to trade EUR/USD

The Best brokers to trade EUR/USD

SPONSORED Discover the top brokers for trading EUR/USD in 2025. Our list features brokers with competitive spreads, fast execution, and powerful platforms. Whether you're a beginner or an expert, find the right partner to navigate the dynamic Forex market.

Forex MAJORS

Cryptocurrencies

Signatures

Best Brokers of 2025