USD/JPY soars to highest level since November 2022, following US data release


Share:


  • USD/JPY reaches yearly highs and positions near the 140.00 level.
  • US Q1 GDP grew by 1.3%, surpassing expectations, while Jobless Claims exceeded estimates. Core PCE inflation rose 5% in Q1.
  • Investors are eagerly anticipating today's release of the May Tokyo Consumer Price Index.

The Ninja continue edging higher on Thursday, maintaining yearly highs and approaching the key level of 140.00. This surge comes amidst positive economic developments, with the US Q1 GDP growth surpassing expectations and Jobless Claims exceeding estimates. Additionally, core PCE inflation rose by 5% in the first quarter. In that sense, the positive economic data from the United States, coupled with the rise in US bond yields due to the increased likelihood of a Fed adjustment, further favored the US Dollar.

On the other hand, investors will closely monitor the May Tokyo Consumer Price Index, which is expected to further impact the USD/JPY pair.

US economic data came in above expectations

The US Bureau of Economic Analysis recently announced that the United States experienced a 1.3% quarter-on-quarter expansion in Gross Domestic Product (GDP) during Q1 of 2023, surpassing the initial estimate of 1.1%. Additionally, Jobless Claims for the week ending on May 19 came in at 229k, lower than the expected consensus of 245k. Furthermore, Core PCE inflation rose to 5% in Q1, exceeding the projected rate of 4.9%.

In response to concerns expressed by the Federal Open Market Committee (FOMC) regarding economic activity, the CME FedWatch Tool now indicates a higher probability of a 25 bps interest rate increase. This development has fueled an increase in US bond yields, with the 10-year yield reaching 3.79%, reflecting a 3.22% rise in a single day. Additionally, the 2-year yield currently stands at 4.46%, representing a gain of 2.61%, while the 5-year yield sits at 3.87%, showing a 3.22% increase. These movements in bond yields provide further support to the US Dollar.


Levels to watch

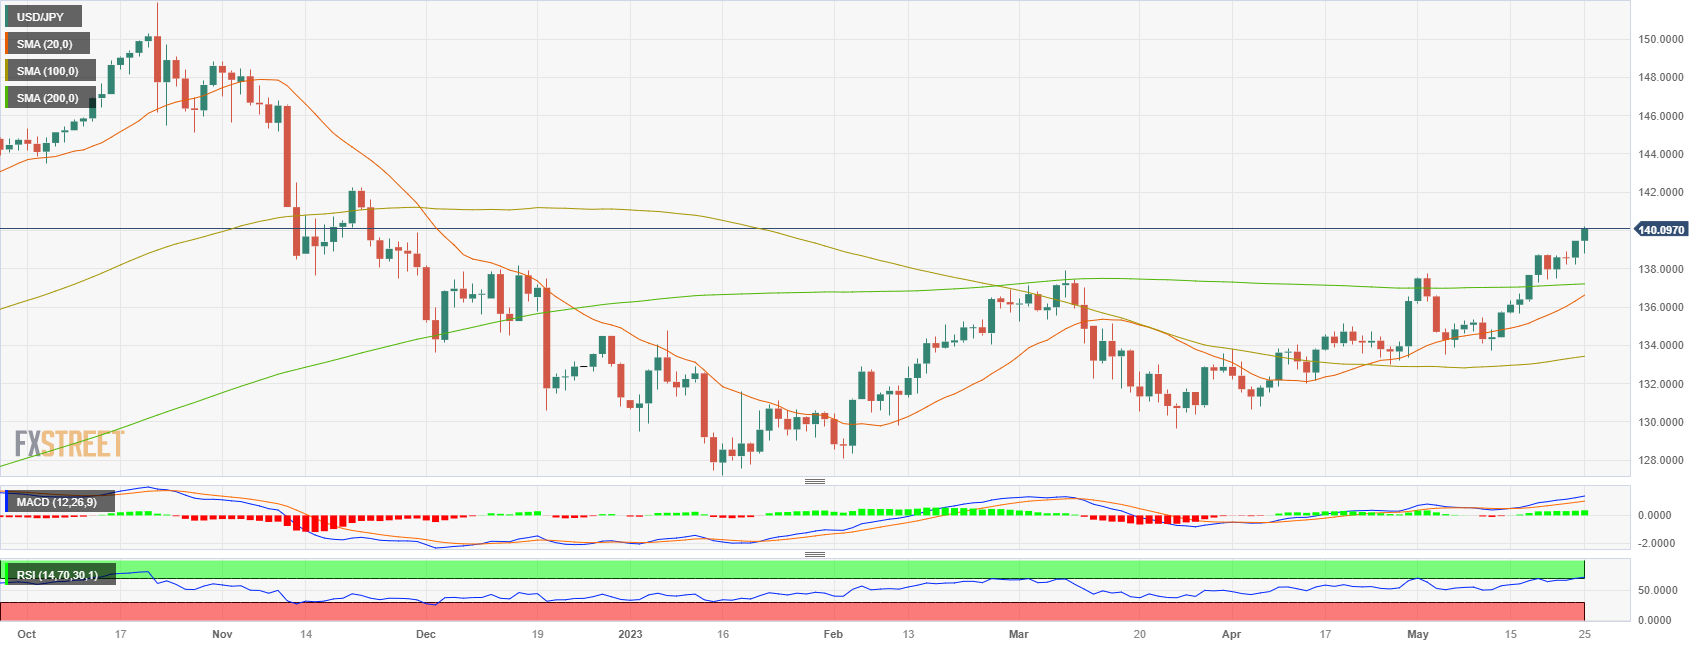
Based on the daily chart analysis, the USD/JPY exhibits a bullish outlook in the short term. The Relative Strength Index (RSI) and Moving Average Convergence Divergence (MACD) indicators indicate the dominance of buyers while the pair remains above its key moving averages. 

If the USD/JPY continues to gather momentum, it is likely to encounter resistance at the 140.00 level, followed by the 140.50 zone and the psychological level of 141.00. Conversely, on the downside, important support levels to monitor include the 139.50 zone, the 139.00 level, and the weekly low at 138.50.


USD/JPY

Overview
Today last price 140.1
Today Daily Change 0.64
Today Daily Change % 0.46
Today daily open 139.46
 
Trends
Daily SMA20 136.32
Daily SMA50 134.18
Daily SMA100 133.36
Daily SMA200 137.19
 
Levels
Previous Daily High 139.48
Previous Daily Low 138.23
Previous Weekly High 138.75
Previous Weekly Low 135.65
Previous Monthly High 136.56
Previous Monthly Low 130.63
Daily Fibonacci 38.2% 139
Daily Fibonacci 61.8% 138.71
Daily Pivot Point S1 138.64
Daily Pivot Point S2 137.81
Daily Pivot Point S3 137.39
Daily Pivot Point R1 139.88
Daily Pivot Point R2 140.3
Daily Pivot Point R3 141.13


Share: Feed news

Information on these pages contains forward-looking statements that involve risks and uncertainties. Markets and instruments profiled on this page are for informational purposes only and should not in any way come across as a recommendation to buy or sell in these assets. You should do your own thorough research before making any investment decisions. FXStreet does not in any way guarantee that this information is free from mistakes, errors, or material misstatements. It also does not guarantee that this information is of a timely nature. Investing in Open Markets involves a great deal of risk, including the loss of all or a portion of your investment, as well as emotional distress. All risks, losses and costs associated with investing, including total loss of principal, are your responsibility. The views and opinions expressed in this article are those of the authors and do not necessarily reflect the official policy or position of FXStreet nor its advertisers. The author will not be held responsible for information that is found at the end of links posted on this page.

If not otherwise explicitly mentioned in the body of the article, at the time of writing, the author has no position in any stock mentioned in this article and no business relationship with any company mentioned. The author has not received compensation for writing this article, other than from FXStreet.

FXStreet and the author do not provide personalized recommendations. The author makes no representations as to the accuracy, completeness, or suitability of this information. FXStreet and the author will not be liable for any errors, omissions or any losses, injuries or damages arising from this information and its display or use. Errors and omissions excepted.

The author and FXStreet are not registered investment advisors and nothing in this article is intended to be investment advice.

Follow us on Telegram

Stay updated of all the news

Join Telegram

Recommended content


Follow us on Telegram

Stay updated of all the news

Join Telegram

Recommended content

Editors’ Picks

EUR/USD battles 1.0700 after mixed Eurozone data

EUR/USD battles 1.0700 after mixed Eurozone data

EUR/USD has come under renewed selling pressure, battling 1.0700 after mixed Eurozone Retail Sales data for April. The pair remains undermined by the cautious market mood, disappointing German Factory Orders and a broad US Dollar rebound. 

EUR/USD News

GBP/USD turns south toward 1.2400 as US Dollar recovers

GBP/USD turns south toward 1.2400 as US Dollar recovers

GBP/USD is heading south toward 1.2400, meeting fresh supply in the European session. The US Dollar is seeing renewed safe-haven buying amid a risk-off market profile, acting as a headwind to the pair. 

GBP/USD News

Gold oscillates around $1,960 amid mixed responses to Fed’s June policy

Gold oscillates around $1,960 amid mixed responses to Fed’s June policy

Gold price is auctioning inside the woods around $1,960.00 in the early London session. The precious metal is displaying back-and-forth action as the investing community is divided about the interest rate decision by the Fed to be taken in June’s monetary policy meeting.

Gold News

Is the metaverse hype back in action?

Is the metaverse hype back in action?

Although there are no major macroeconomic events this week, investors can expect massive volatility on a daily basis. The reasoning behind this outlook is that Apple will be conducting the 2023 Apple Worldwide Developers Conference (WWDC) on June 5.

Read more

Markets are likely to focus on ECB commentary

Markets are likely to focus on ECB commentary

This is a very quiet week in terms of data and hence markets are likely to focus on last minute central bank commentary. The FOMC blackout period kicked off already on Sunday, but today we have a bunch of ECB speakers on the wires.

Read more

Forex MAJORS

Cryptocurrencies

Signatures