- USD/JPY rebounds 0.35% from 151.64 low, driven by bond yield movements.
- Technical analysis hints at bullish shift; resistance near 200-day SMA at 152.76.
- Downside risks if SMA not surpassed; supports at 152.00 and 150.93 in focus.
The USD/JPY climbed during the North American session. It trades at 152.52 and posts gains of over 0.35% after hitting a daily low of 151.64. The rise of the US 10-year T-note bond yield spurred the rise of the pair, which is positively correlated to the yield of the 10-year.
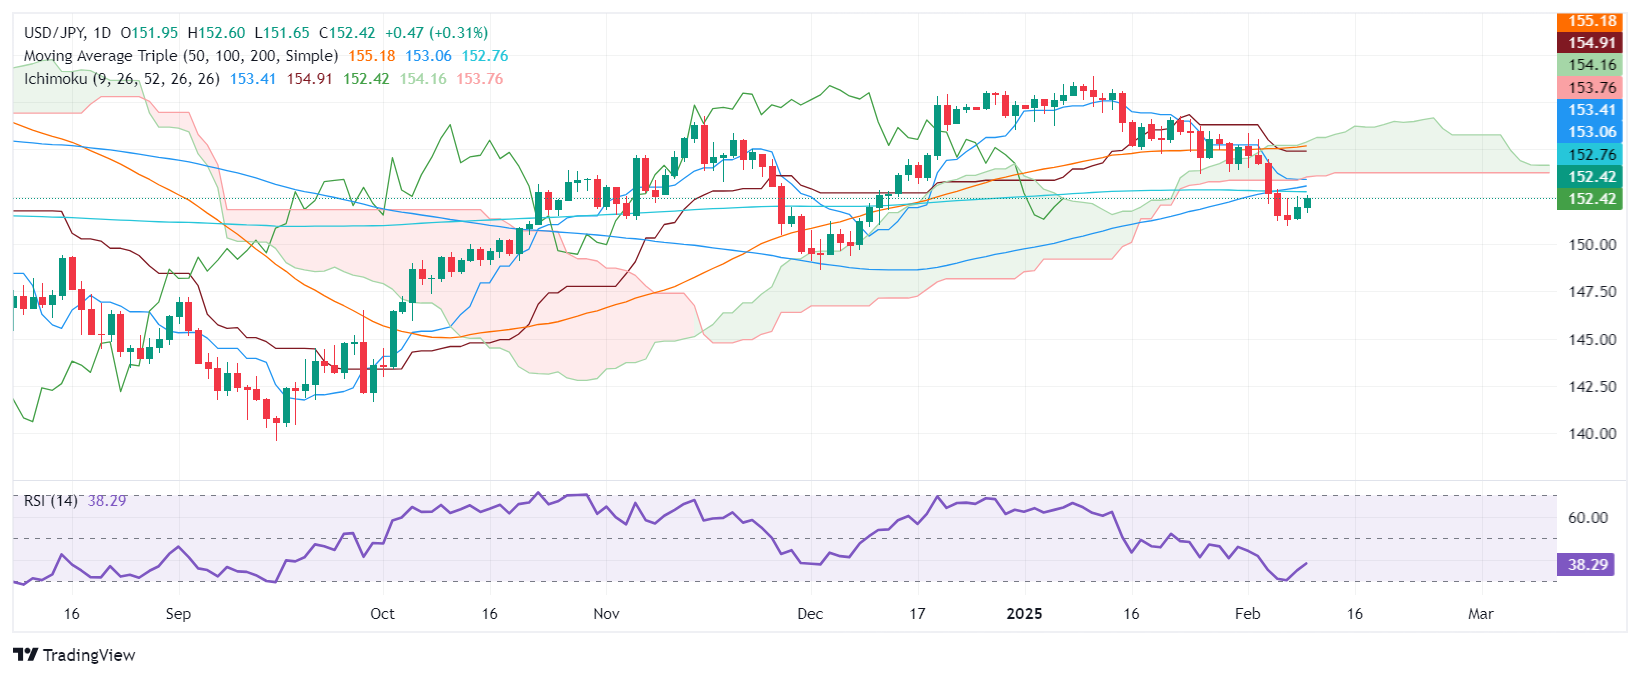
USD/JPY Price Forecast: Technical outlook
The USD/JPY remains biased downward, even though buyers could challenge the 200-day Simple Moving Average (SMA) at 152.76. The momentum shifted slightly bullish even though the relative strength index (RSI) remains bearish, and the slope aims upwards.
If buyers regain the 200-day SMA, the following key resistance would be the 153.00 mark before testing the Senkou Span B base at 153.76.
On the other hand, if USD/JPY stays below the 200-day SMA, the first support would be the 152.00 figure. Further losses lie below the February 7 daily low of 150.93, followed by the December 3 swing low of 148.64.
USD/JPY Price Chart – Daily
Japanese Yen PRICE Today
The table below shows the percentage change of Japanese Yen (JPY) against listed major currencies today. Japanese Yen was the strongest against the Swiss Franc.
USD | EUR | GBP | JPY | CAD | AUD | NZD | CHF | |
---|---|---|---|---|---|---|---|---|
USD | -0.53% | -0.60% | 0.30% | -0.16% | -0.28% | -0.23% | 0.16% | |
EUR | 0.53% | -0.08% | 0.85% | 0.39% | 0.25% | 0.30% | 0.70% | |
GBP | 0.60% | 0.08% | 0.93% | 0.46% | 0.31% | 0.36% | 0.76% | |
JPY | -0.30% | -0.85% | -0.93% | -0.45% | -0.59% | -0.53% | -0.14% | |
CAD | 0.16% | -0.39% | -0.46% | 0.45% | -0.13% | -0.08% | 0.31% | |
AUD | 0.28% | -0.25% | -0.31% | 0.59% | 0.13% | 0.05% | 0.44% | |
NZD | 0.23% | -0.30% | -0.36% | 0.53% | 0.08% | -0.05% | 0.39% | |
CHF | -0.16% | -0.70% | -0.76% | 0.14% | -0.31% | -0.44% | -0.39% |
The heat map shows percentage changes of major currencies against each other. The base currency is picked from the left column, while the quote currency is picked from the top row. For example, if you pick the Japanese Yen from the left column and move along the horizontal line to the US Dollar, the percentage change displayed in the box will represent JPY (base)/USD (quote).
Information on these pages contains forward-looking statements that involve risks and uncertainties. Markets and instruments profiled on this page are for informational purposes only and should not in any way come across as a recommendation to buy or sell in these assets. You should do your own thorough research before making any investment decisions. FXStreet does not in any way guarantee that this information is free from mistakes, errors, or material misstatements. It also does not guarantee that this information is of a timely nature. Investing in Open Markets involves a great deal of risk, including the loss of all or a portion of your investment, as well as emotional distress. All risks, losses and costs associated with investing, including total loss of principal, are your responsibility. The views and opinions expressed in this article are those of the authors and do not necessarily reflect the official policy or position of FXStreet nor its advertisers. The author will not be held responsible for information that is found at the end of links posted on this page.
If not otherwise explicitly mentioned in the body of the article, at the time of writing, the author has no position in any stock mentioned in this article and no business relationship with any company mentioned. The author has not received compensation for writing this article, other than from FXStreet.
FXStreet and the author do not provide personalized recommendations. The author makes no representations as to the accuracy, completeness, or suitability of this information. FXStreet and the author will not be liable for any errors, omissions or any losses, injuries or damages arising from this information and its display or use. Errors and omissions excepted.
The author and FXStreet are not registered investment advisors and nothing in this article is intended to be investment advice.
Recommended content
Editors’ Picks

EUR/USD stabilizes above 1.1350 on Easter Friday
EUR/USD enters a consolidation phase above 1.1350 on Friday as the trading action remains subdued, with major markets remaining closed in observance of the Easter Holiday. On Thursday, the European Central Bank (ECB) announced it cut key rates by 25 bps, as expected.

GBP/USD fluctuates below 1.3300, looks to post weekly gains
After setting a new multi-month high near 1.3300 earlier in the week, GBP/USD trades in a narrow band at around 1.32700 on Friday and remains on track to end the week in positive territory. Markets turn quiet on Friday as trading conditions thin out on Easter Holiday.

Gold ends week with impressive gains above $3,300
Gold retreated slightly from the all-time high it touched at $3,357 early Thursday but still gained more than 2% for the week after settling at $3,327. The uncertainty surrounding US-China trade relations caused markets to adopt a cautious stance, boosting safe-haven demand for Gold.

How SEC-Ripple case and ETF prospects could shape XRP’s future
Ripple consolidated above the pivotal $2.00 level while trading at $2.05 at the time of writing on Friday, reflecting neutral sentiment across the crypto market.

Future-proofing portfolios: A playbook for tariff and recession risks
It does seem like we will be talking tariffs for a while. And if tariffs stay — in some shape or form — even after negotiations, we’ll likely be talking about recession too. Higher input costs, persistent inflation, and tighter monetary policy are already weighing on global growth.

The Best brokers to trade EUR/USD
SPONSORED Discover the top brokers for trading EUR/USD in 2025. Our list features brokers with competitive spreads, fast execution, and powerful platforms. Whether you're a beginner or an expert, find the right partner to navigate the dynamic Forex market.