USD/JPY Price Forecast: Skyrockets over 200-pips on Japan’s PM comments
- USD/JPY surges over 2%, rallying from a low of 143.42 following comments from Japan’s Prime Minister Ishiba.
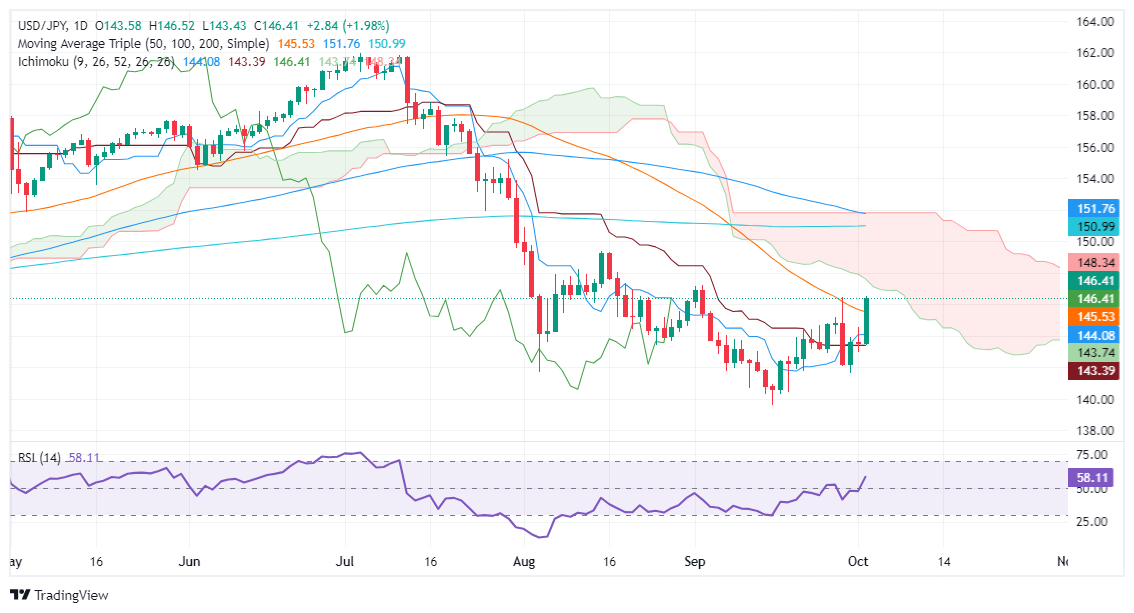
- The pair breaks significant resistance, including the 50-DMA at 145.53, now trading near 146.47.
- For a bearish reversal, USD/JPY needs to drop below the 50-DMA, with 145.00 as the subsequent key support.

The Greenback recovered against the Japanese Yen on Wednesday, rallying over 2% after Japanese Prime Minister Ishiba commented the economic environment is not ready for additional rate hikes. Hence, the USD/JPY jumped off daily lows of around 143.42 and soared sharply toward current exchange rates. At the time of writing, the pair trades at 146.47.
USD/JPY Price Forecast: Technical outlook
The USD/JPY has broken key resistance levels and is descending toward the bottom of the Ichimoku Cloud (Kumo).
Firstly, it broke a resistance trendline drawn from around August 15 highs, which passed at around 144.00/10. Once this was cleared, it opened the door for further upside.
After that, the USD/JPY climbed above the October 1 high of 144.53, followed by the 145.00 figure. Once surpassed, there was not in the bull's path as they exceeded the 50-day moving average (DMA) at 145.53, on its way toward the current exchange rates.
For a bearish resumption, the USD/JPY must clear the 50-DMA on the downside, which will expose the 145.00 mark.
USD/JPY Price Action – Daily Chart
Japanese Yen PRICE Today
The table below shows the percentage change of Japanese Yen (JPY) against listed major currencies today. Japanese Yen was the strongest against the British Pound.
| USD | EUR | GBP | JPY | CAD | AUD | NZD | CHF | |
|---|---|---|---|---|---|---|---|---|
| USD | -0.02% | 0.02% | -0.01% | 0.02% | 0.00% | -0.38% | -0.00% | |
| EUR | 0.02% | 0.02% | -0.02% | 0.03% | 0.04% | -0.39% | 0.02% | |
| GBP | -0.02% | -0.02% | -0.06% | -0.02% | 0.02% | -0.01% | 0.01% | |
| JPY | 0.01% | 0.02% | 0.06% | 0.04% | 0.05% | -0.02% | 0.05% | |
| CAD | -0.02% | -0.03% | 0.02% | -0.04% | 0.00% | -0.09% | -0.00% | |
| AUD | -0.00% | -0.04% | -0.02% | -0.05% | -0.01% | -0.02% | 0.02% | |
| NZD | 0.38% | 0.39% | 0.00% | 0.02% | 0.09% | 0.02% | 0.01% | |
| CHF | 0.00% | -0.02% | -0.01% | -0.05% | 0.00% | -0.02% | -0.01% |
The heat map shows percentage changes of major currencies against each other. The base currency is picked from the left column, while the quote currency is picked from the top row. For example, if you pick the Japanese Yen from the left column and move along the horizontal line to the US Dollar, the percentage change displayed in the box will represent JPY (base)/USD (quote).
Author

Christian Borjon Valencia
FXStreet
Markets analyst, news editor, and trading instructor with over 14 years of experience across FX, commodities, US equity indices, and global macro markets.