USD/JPY Price Forecast: Rallies past 144.00 boosted by high US yields
- USD/JPY climbs over 0.90% to 144.54, buoyed by a rise in the US 10-year Treasury yield.
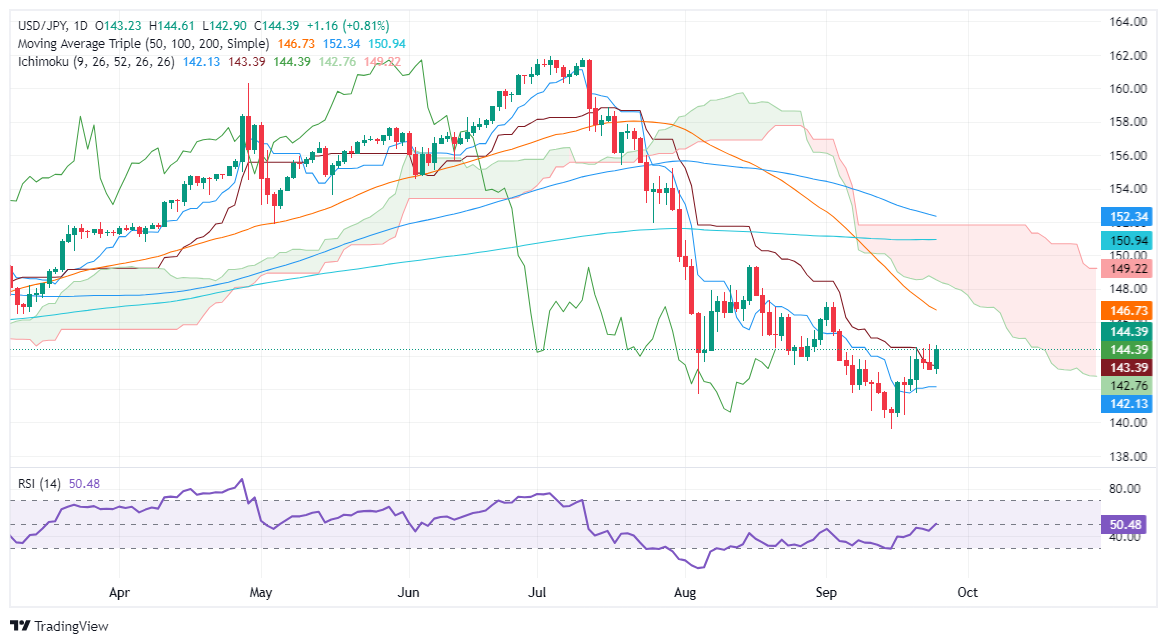
- Despite the uptick, the pair shows a downward trend, remaining below the Ichimoku Cloud and 200-DMA.
- RSI crosses above the neutral line, suggesting potential for continued gains in the short term.
- Key resistance at 145.00, with subsequent levels at 146.73 (50-DMA) and 147.00.
- A fall below 144.00 could find support at 143.39 (Kijun-Sen), 142.76 (Senkou Span A), and 142.13 (Tenkan-Sen).

The USD/JPY edges up during the North American session, registering gains of over 0.90% as the US Dollar stages a comeback. The rise in the US 10-year T-note yield sponsored a leg-up in the pair, which trades at 144.54 at the time of writing.
USD/JPY Price Forecast: Technical outlook
Despite rallying during the session, the USD/JPY remains downward biased, as the exchange rate persists below the Ichimoku Cloud (Kumo) and the 200-day moving average (DMA).
The Relative Strength Index (RSI) has just pierced its neutral line, opening the door for further upside in the near term.
With that said, the USD/JPY next resistance would be the 145.00 psychological figure ahead of testing the 50-DMA at 146.73. On further strength, the pair could hit the 147.00 figure.
Conversely, if USD/JPY tumbles below 144.00, this could pave the way to challenge the Kijun-Sen at 143.39, followed by the Senkou Span A at 142.76 and the Tenkan Sen at 142.13.
USD/JPY Price Action – Daily Chart
Japanese Yen PRICE Today
The table below shows the percentage change of Japanese Yen (JPY) against listed major currencies today. Japanese Yen was the strongest against the New Zealand Dollar.
| USD | EUR | GBP | JPY | CAD | AUD | NZD | CHF | |
|---|---|---|---|---|---|---|---|---|
| USD | 0.22% | 0.51% | 0.82% | 0.26% | 0.75% | 0.91% | 0.68% | |
| EUR | -0.22% | 0.29% | 0.60% | 0.04% | 0.53% | 0.70% | 0.45% | |
| GBP | -0.51% | -0.29% | 0.27% | -0.25% | 0.24% | 0.37% | 0.18% | |
| JPY | -0.82% | -0.60% | -0.27% | -0.56% | -0.07% | 0.09% | -0.14% | |
| CAD | -0.26% | -0.04% | 0.25% | 0.56% | 0.49% | 0.66% | 0.43% | |
| AUD | -0.75% | -0.53% | -0.24% | 0.07% | -0.49% | 0.17% | -0.07% | |
| NZD | -0.91% | -0.70% | -0.37% | -0.09% | -0.66% | -0.17% | -0.24% | |
| CHF | -0.68% | -0.45% | -0.18% | 0.14% | -0.43% | 0.07% | 0.24% |
The heat map shows percentage changes of major currencies against each other. The base currency is picked from the left column, while the quote currency is picked from the top row. For example, if you pick the Japanese Yen from the left column and move along the horizontal line to the US Dollar, the percentage change displayed in the box will represent JPY (base)/USD (quote).
Author

Christian Borjon Valencia
FXStreet
Markets analyst, news editor, and trading instructor with over 14 years of experience across FX, commodities, US equity indices, and global macro markets.