USD/JPY Price Forecast: Dips to 4-week lows, before trimming some losses
- USD/JPY hits four-week low of 142.68, but rebounds as US jobs and ISM data support the Greenback.
- Powell keeps hawkish tone, saying July rate cut not guaranteed; RSI signals limited bullish momentum.
- Key support lies at 143.00 and 142.11; resistance capped near 144.50–145.35 Ichimoku cloud zone.

The USD/JPY posted mild losses of 0.17% after hitting a new four-week low of 142.68, sponsored by upbeat economic data in Japan. However, good US jobs and business activity data, along with a hawkish Fed Chair Jerome Powell, lent a lifeline to the US dollar, which staged a comeback versus the Japanese Yen (JPY). At the moment, the pair trades at 143.77.
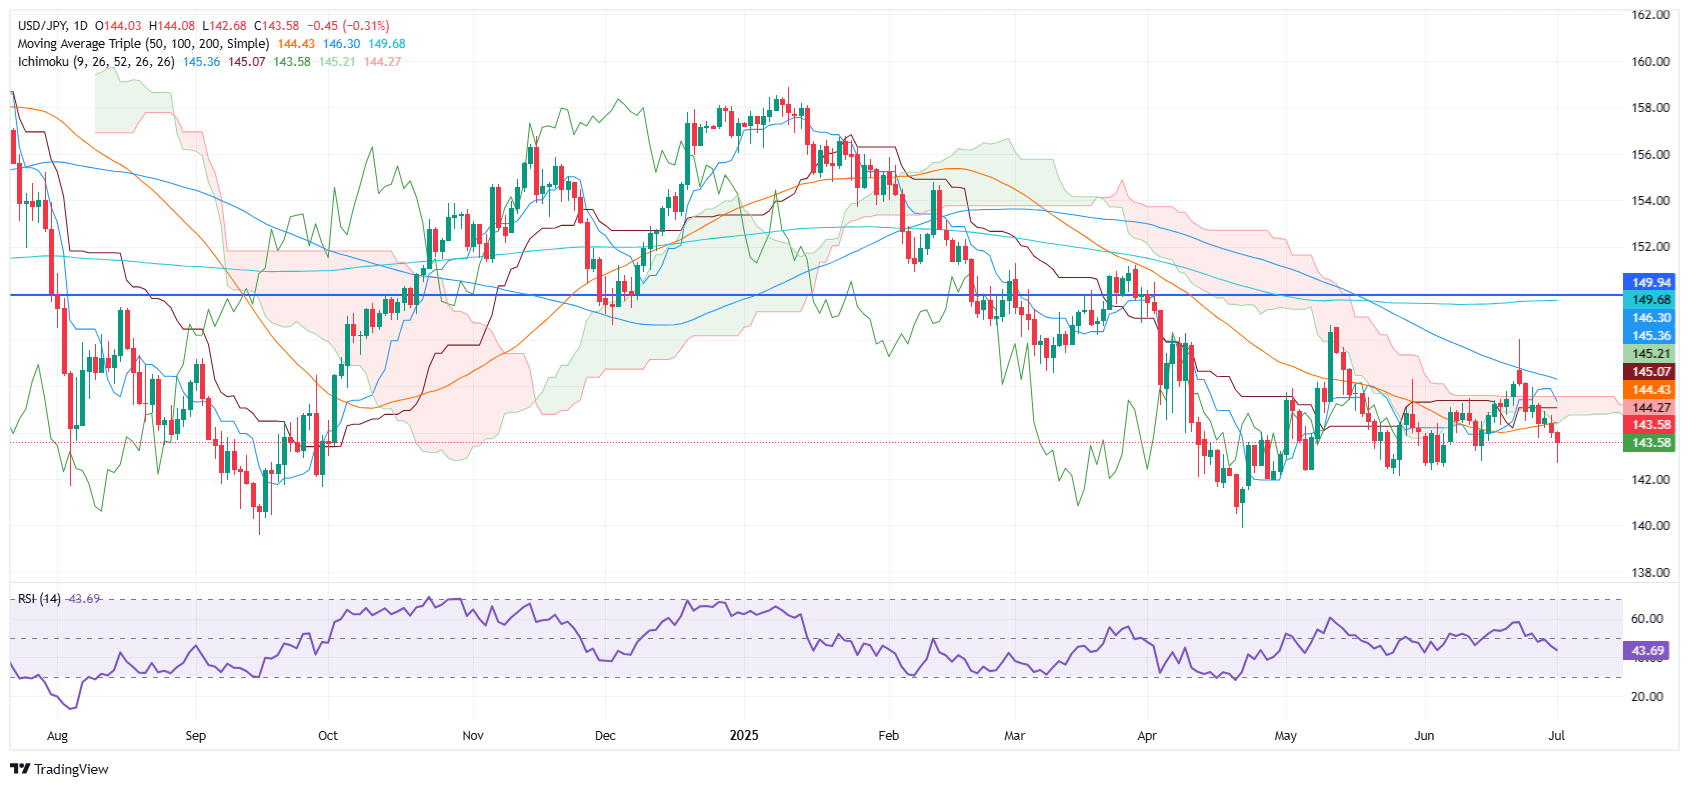
USD/JPY Price Forecast: Technical outlook
The USD/JPY remains neutral-to upward biased if the pair remains above the May 27 swing low of 142.11. However, upside movements could be capped by strong resistance at the bottom of the Ichimoku Cloud (kumo) at around 144.25-50. This, along with the Relative Strength Index (RSI) remaining bearish, suggests that consolidation lies ahead.
For a bullish case, the USD/JPY must clear 144.50, and the confluence of several moving averages, such as the 20- and 50-day SMAs. Once surpassed, the next area of interest would be the Kijun-sen at 145.07, ahead of the Tenkan-sen at 145.35. A breach of the latter will expose the 100-day SMA at 146.32, followed by the June 23 high of 148.02.
On the other hand, if USD/JPY falls below 143.00, a further downside is expected to occur, with a potential target of 142.00.
USD/JPY Price Chart – Daily
Japanese Yen PRICE Today
The table below shows the percentage change of Japanese Yen (JPY) against listed major currencies today. Japanese Yen was the strongest against the Canadian Dollar.
| USD | EUR | GBP | JPY | CAD | AUD | NZD | CHF | |
|---|---|---|---|---|---|---|---|---|
| USD | -0.09% | -0.11% | -0.33% | 0.27% | -0.05% | -0.08% | -0.15% | |
| EUR | 0.09% | -0.01% | -0.31% | 0.36% | 0.13% | 0.02% | -0.04% | |
| GBP | 0.11% | 0.00% | -0.20% | 0.40% | 0.15% | 0.02% | -0.02% | |
| JPY | 0.33% | 0.31% | 0.20% | 0.65% | 0.27% | 0.27% | 0.19% | |
| CAD | -0.27% | -0.36% | -0.40% | -0.65% | -0.33% | -0.36% | -0.43% | |
| AUD | 0.05% | -0.13% | -0.15% | -0.27% | 0.33% | -0.13% | -0.18% | |
| NZD | 0.08% | -0.02% | -0.02% | -0.27% | 0.36% | 0.13% | -0.04% | |
| CHF | 0.15% | 0.04% | 0.02% | -0.19% | 0.43% | 0.18% | 0.04% |
The heat map shows percentage changes of major currencies against each other. The base currency is picked from the left column, while the quote currency is picked from the top row. For example, if you pick the Japanese Yen from the left column and move along the horizontal line to the US Dollar, the percentage change displayed in the box will represent JPY (base)/USD (quote).
Author

Christian Borjon Valencia
FXStreet
Markets analyst, news editor, and trading instructor with over 14 years of experience across FX, commodities, US equity indices, and global macro markets.


