USD/JPY Price Analysis: Turns bearish, sliding below the one-hour 200-EMA, as sellers eye 143.00


  • USD/JPY drops on a risk-on impulse due to equities rising amidst a falling greenback and US T-bond yields.
  • If the USD/JPY clears 144.00, the pair could tumble to 143.00.
  • Even though RSI is at oversold conditions, the break of the 200-EMA in the hourly chart shifted the bias downwards.

USD/JPY is subdued, falling for the second straight day as global equities extended their rally, following actions of some central banks, like the Bank of England (BoE) and the Reserve Bank of Australia (RBA), taking a “dovish” stance. Therefore, speculations that the Fed might follow suit sent US T-bond yields and the greenback diving. At the time of writing, the USD/JPY is trading at 144.07, shy of the 144.00 figure, down 0.32%.

USD/JPY Price Analysis: Technical outlook

From a technical analysis perspective, the USD/JPY is still upward biased, even though it is approaching the 20-day EMA at 143.76. Upside lies resistance at around 144.00, followed by Monday’s high at 144.93, ahead of the Bank of Japan’s (BoJ) line on the sand at 145.00.

For the major to shift neutral, the USD/JPY would need to collapse below the September 22 low of 140.34. Once cleared, the next support would be the 50-day EMA at 139.11.

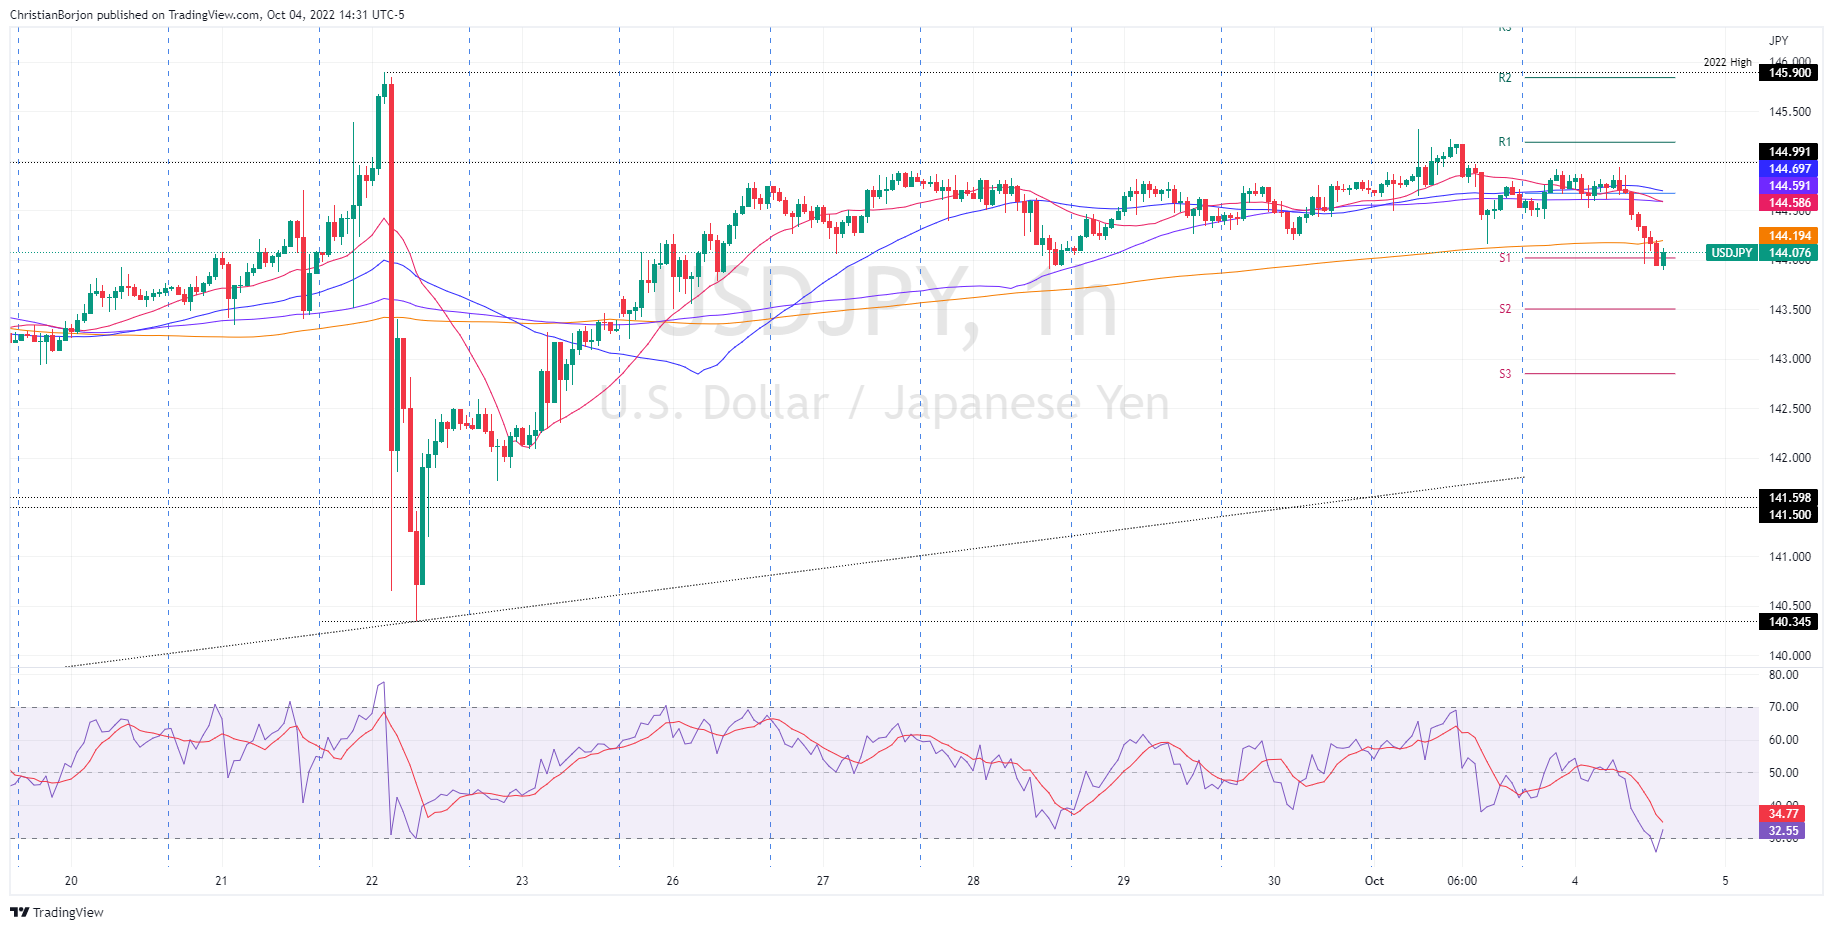
The USD/JPY one-hour scale shows the majors tumbled below 144.67, Tuesday’s daily pivot, and the confluence of the 20, 50, and 100-EMAs, opening the door for further losses. Furthermore, as the USD/JPY heads south, it surpassed the 200-EMA at 144.19, shifting the short-term bias downwards. Albeit the Relative Strength Index (RSI) is at oversold conditions, a fall towards the S2 pivot point at 143.49, ahead of a test of the 143.00 figure.

USD/JPY Key Technical Levels

USD/JPY

Overview
Today last price 144.06
Today Daily Change -0.47
Today Daily Change % -0.33
Today daily open 144.53
 
Trends
Daily SMA20 143.71
Daily SMA50 139
Daily SMA100 136.35
Daily SMA200 128.12
 
Levels
Previous Daily High 145.32
Previous Daily Low 144.16
Previous Weekly High 144.9
Previous Weekly Low 143.25
Previous Monthly High 145.9
Previous Monthly Low 138.78
Daily Fibonacci 38.2% 144.6
Daily Fibonacci 61.8% 144.88
Daily Pivot Point S1 144.02
Daily Pivot Point S2 143.5
Daily Pivot Point S3 142.85
Daily Pivot Point R1 145.18
Daily Pivot Point R2 145.84
Daily Pivot Point R3 146.35


Share: Feed news

Information on these pages contains forward-looking statements that involve risks and uncertainties. Markets and instruments profiled on this page are for informational purposes only and should not in any way come across as a recommendation to buy or sell in these assets. You should do your own thorough research before making any investment decisions. FXStreet does not in any way guarantee that this information is free from mistakes, errors, or material misstatements. It also does not guarantee that this information is of a timely nature. Investing in Open Markets involves a great deal of risk, including the loss of all or a portion of your investment, as well as emotional distress. All risks, losses and costs associated with investing, including total loss of principal, are your responsibility. The views and opinions expressed in this article are those of the authors and do not necessarily reflect the official policy or position of FXStreet nor its advertisers. The author will not be held responsible for information that is found at the end of links posted on this page.

If not otherwise explicitly mentioned in the body of the article, at the time of writing, the author has no position in any stock mentioned in this article and no business relationship with any company mentioned. The author has not received compensation for writing this article, other than from FXStreet.

FXStreet and the author do not provide personalized recommendations. The author makes no representations as to the accuracy, completeness, or suitability of this information. FXStreet and the author will not be liable for any errors, omissions or any losses, injuries or damages arising from this information and its display or use. Errors and omissions excepted.

The author and FXStreet are not registered investment advisors and nothing in this article is intended to be investment advice.

Recommended content


Recommended content

Editors’ Picks

AUD/USD tumbles toward 0.6350 as Middle East war fears mount

AUD/USD tumbles toward 0.6350 as Middle East war fears mount

AUD/USD has come under intense selling pressure and slides toward 0.6350, as risk-aversion intensifies following the news that Israel retaliated with missile strikes on a site in Iran. Fears of the Israel-Iran strife translating into a wider regional conflict are weighing on the higher-yielding Aussie Dollar. 

AUD/USD News

USD/JPY breaches 154.00 as sell-off intensifies on Israel-Iran escalation

USD/JPY breaches 154.00 as sell-off intensifies on Israel-Iran escalation

USD/JPY is trading below 154.00 after falling hard on confirmation of reports of an Israeli missile strike on Iran, implying that an open conflict is underway and could only spread into a wider Middle East war. Safe-haven Japanese Yen jumped, helped by BoJ Governor Ueda's comments. 

USD/JPY News

Gold price jumps above $2,400 as MidEast escalation sparks flight to safety

Gold price jumps above $2,400 as MidEast escalation sparks flight to safety

Gold price has caught a fresh bid wave, jumping beyond $2,400 after Israel's retaliatory strikes on Iran sparked a global flight to safety mode and rushed flows into the ultimate safe-haven Gold. Risk assets are taking a big hit, as risk-aversion creeps into Asian trading on Friday. 

Gold News

WTI surges to $85.00 amid Israel-Iran tensions

WTI surges to $85.00 amid Israel-Iran tensions

Western Texas Intermediate, the US crude oil benchmark, is trading around $85.00 on Friday. The black gold gains traction on the day amid the escalating tension between Israel and Iran after a US official confirmed that Israeli missiles had hit a site in Iran.

Oil News

Dogwifhat price pumps 5% ahead of possible Coinbase effect

Dogwifhat price pumps 5% ahead of possible Coinbase effect

Dogwifhat price recorded an uptick on Thursday, going as far as to outperform its peers in the meme coins space. Second only to Bonk Inu, WIF token’s show of strength was not just influenced by Bitcoin price reclaiming above $63,000.

Read more

Forex MAJORS

Cryptocurrencies

Signatures