|

USD/JPY Price Analysis: Stumbles to fresh weekly lows around 132.10s

  • USD/JPY drops 0.70% on risk aversion and a softer US Dollar.
  • USD/JPY Price Analysis: Downward biased, could extend its losses below 130.00, towards May lows around 126.00.

The USD/JPY is falling for the second consecutive day as risk aversion continues to drive the last trading day of 2022, as shown by Wall Street registering losses. The USD/JPY extended its fall below the December 29 daily low of 132.87 and stabilized at current exchange rates after hitting a daily low of 131.50. At the time of typing, the USD/JPY is trading at 132.11.

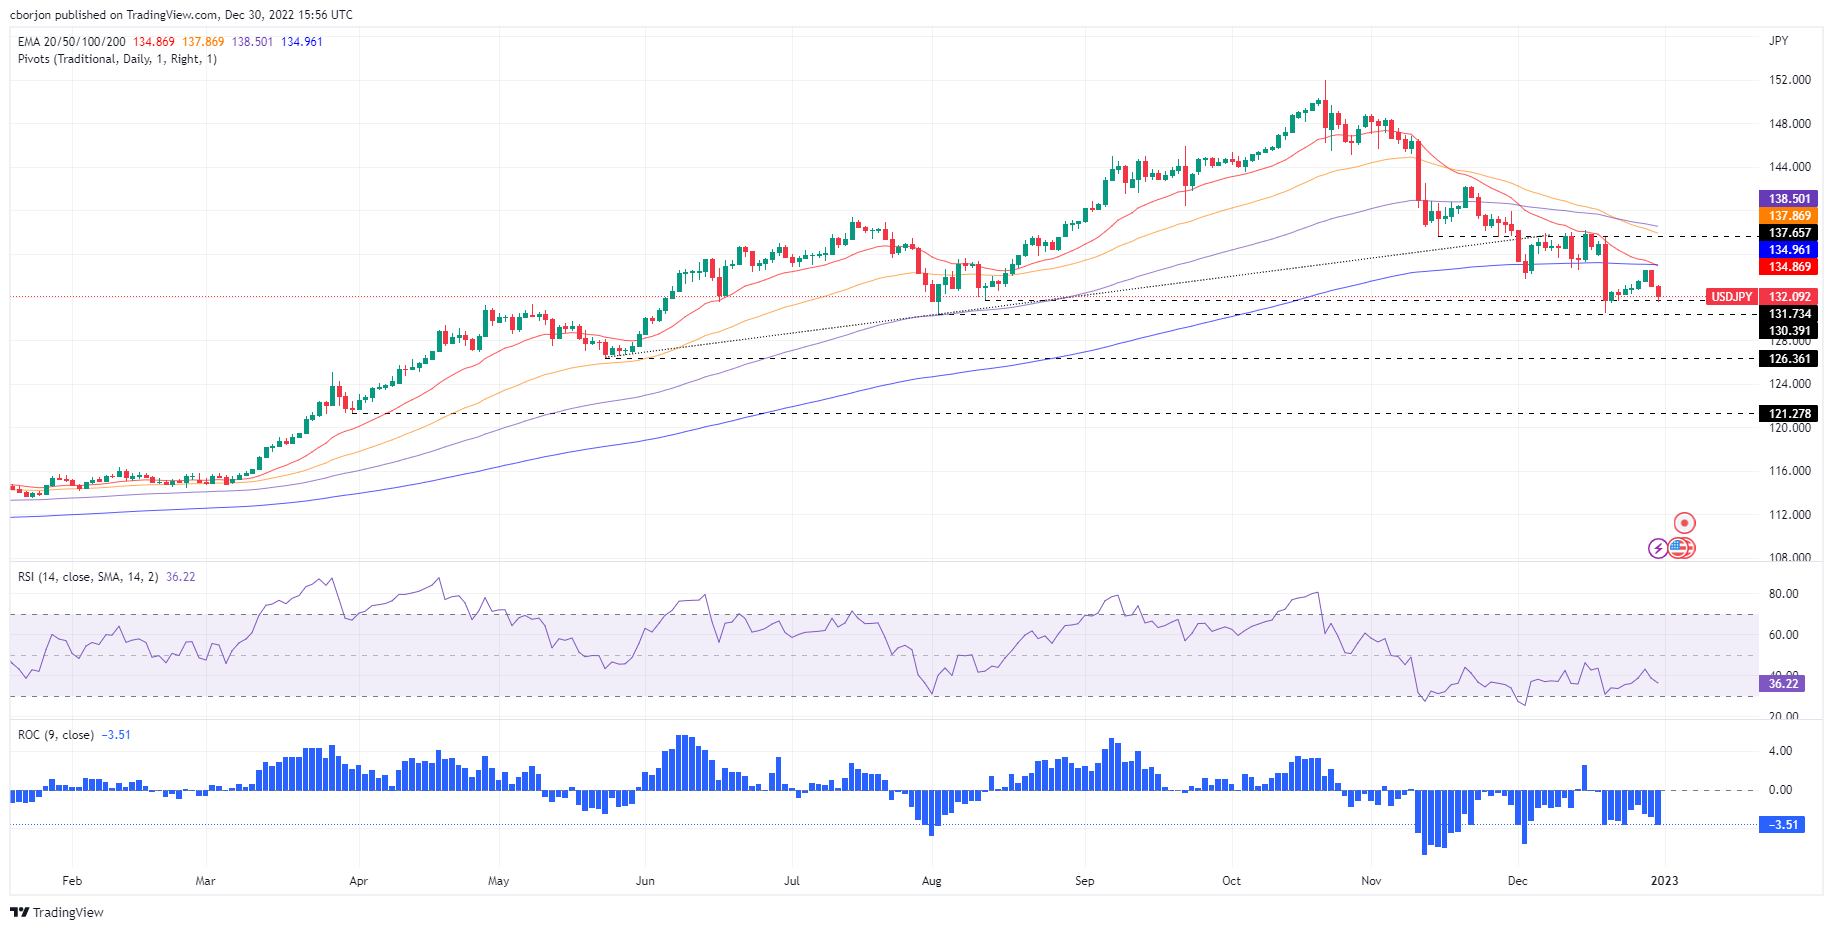
USD/JPY Price Analysis: Technical outlook

From a daily chart perspective, the USD/JPY might continue to drop further, but until it breaks the December 20 daily low of 130.56, that could pave the way to test 130.00. At the time of writing, the 20-day Exponential Moving Average (EMA) crossed below the 200-day EMA, exacerbating further downside action. Since peaking at around 151.94 in October, the USD/JPY has recorded successive series of lower highs and lows, confirming the downtrend. Additionally, the Relative Strength Index (RSI) and the Rate of Change (RoC) are in bearish territory, suggesting that sellers are in charge.

That said, the USD/JPY first support would be 130.56, followed by the figure at 130.00. The break below will expose the May 24 swing low of 126.36, followed by the March 31 low of 121.27.

USD/JPY Key Technical Levels

USD/JPY

Overview
Today last price132.1
Today Daily Change-0.92
Today Daily Change %-0.69
Today daily open133.02
 
Trends
Daily SMA20135.06
Daily SMA50139.89
Daily SMA100141.12
Daily SMA200136.18
 
Levels
Previous Daily High134.5
Previous Daily Low132.88
Previous Weekly High137.48
Previous Weekly Low130.57
Previous Monthly High148.82
Previous Monthly Low137.5
Daily Fibonacci 38.2%133.5
Daily Fibonacci 61.8%133.88
Daily Pivot Point S1132.43
Daily Pivot Point S2131.84
Daily Pivot Point S3130.81
Daily Pivot Point R1134.06
Daily Pivot Point R2135.09
Daily Pivot Point R3135.68

Author

Christian Borjon Valencia

Markets analyst, news editor, and trading instructor with over 14 years of experience across FX, commodities, US equity indices, and global macro markets.

More from Christian Borjon Valencia
Share:

Editor's Picks

AUD/USD falls to near 0.7100 after slipping below 50-day EMA

AUD/USD depreciates after registering minor gains in the previous day, trading around 0.7120 during the Asian hours. The technical analysis of the daily chart shows the pair consolidating sideways within a rectangle pattern, as neither bulls nor bears gain control. The AUD/USD pair is holding a slight bearish tone however as it sits beneath both the nine-day and 50-day EMAs.

USD/JPY coiling up around 160.00 amid 'Yentervention' threats

USD/JPY sits glued near 160.00 in Asia on Friday, as the Japanese Yen remains supported by persistent 'Yentervention' threats by Japan's officials. However, the pair's downside remains capped by the Mideast tensions-led risk-off mood and the US Dollar's bullish consolidation.

Gold returns to the red, awaits US NFP

Gold price is looking to test the weekly lows, while in the red near $4,450 in the early European session on Friday. The precious metal remains vulnerable amid ongoing geopolitical turmoil. Traders will closely monitor the developments surrounding the US-Iran peace deal and the US May employment report later on Friday.


Indian Rupee jumps as RBI holds, but unveils measures to boost foreign inflows

The Reserve Bank of India held the Repo Rate at 5.25%, as widely expected, on Friday. But the central bank unveiled various measures to boost foreign inflows into the economy, lifting the Indian Rupee against the US Dollar.

Top 3 Price Prediction: Bitcoin eyes $60,000, Ethereum risks $1,750, XRP could test $1

Bitcoin, Ethereum, and Ripple prices edge lower on Friday, extending a steady decline of roughly 15% so far this week. Institutional outflows weigh on Bitcoin and Ethereum while XRP largely follows the broader market trend.

Recession on paper: What really moves the Canadian Loonie now?

Statistics Canada handed the headline writers a gift and the analysts a headache. Real GDP shrank 0.1% on an annualized basis in the first quarter, and with the fourth quarter of 2025 revised down to a 1.0% contraction, that is two negative quarters in a row, the textbook definition of a technical recession and Canada's first since the pandemic.