|

USD/JPY Price Analysis: Struggles for direction, though a bullish-engulfing pattern loom

  • USD/JPY tests 50-day EMA at 133.85; bullish-engulfing pattern hints at a potential uptrend.
  • Downside risks loom, with the 100-day EMA at 132.83 in sight if 134.00 support breaks.

The USD/JPY rises after dropping to a weekly low of 133.50, advances 0.42%, spurred by buyers stepping in at around solid technical support level. An upbeat April Nonfarm Payrolls report also lifted the US Dollar (USD) vs. the Japanese Yen (JPY) safety. At the time of writing, the USD/JPY is trading at 134.81 after dipping to a low of 133.88.

USD/JPY Price Action

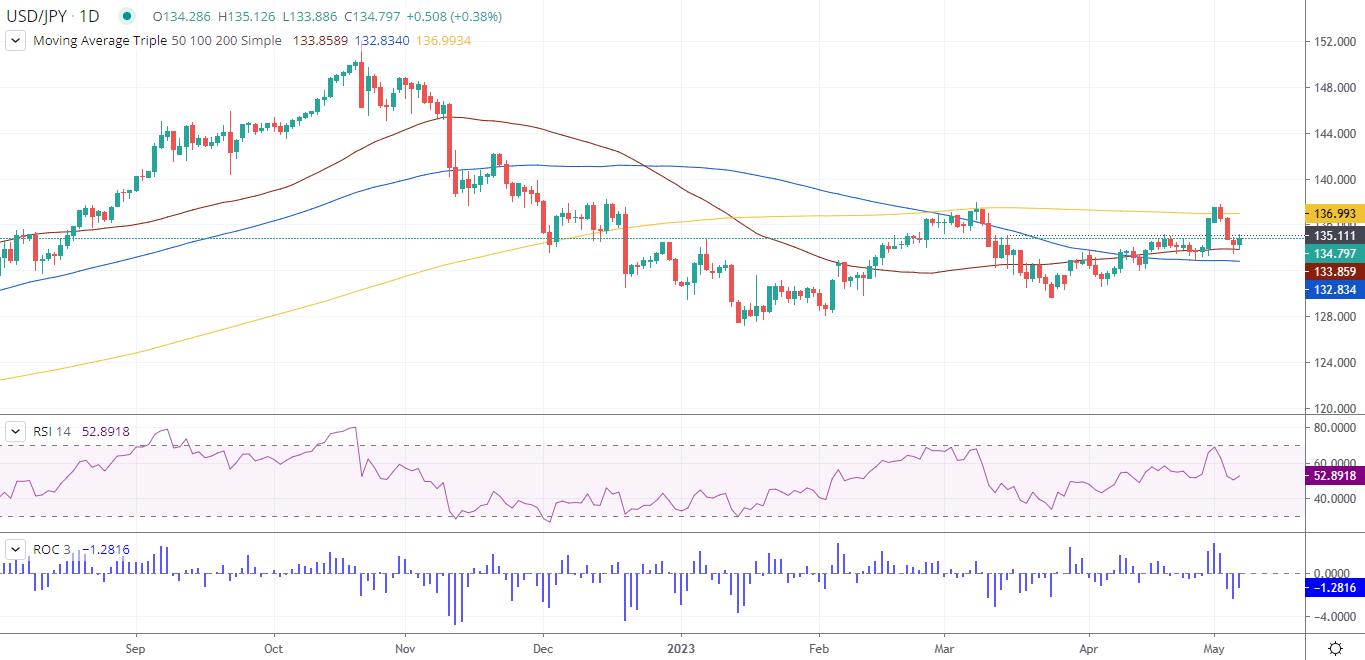
From a daily chart perspective, the USD/JPY remains neutrally biased, though testing the 50-day Exponential Moving Average at 133.85, as the pair battles on closing above the May 4 daily high of 134.85. If USD/JPY achieves a daily close above the latter, the major will form a bullish-engulfing candlestick pattern, keeping buyers hopeful of higher prices.

In that outcome, the USD/JPY next resistance would be 135.00, and the March 15 daily high at 135.11. Once cleared, the USD/JPY would have a clear path to 136.00 until testing the 200-day EMA at 136.99.

Oscillators, like the Relative Strength Index (RSI) indicator, aim up and is still above neutral territory. The Rate of Change (RoC) of the last three days suggests that sellers are losing momentum. Therefore, the USD/JPY would continue to uptrend.

However, if USD/JPY falls below 134.00, it would expose the 50-day EMA at 133.85, followed by the 133.00 figure. Downside risks would pave the way toward the 100-day EMA At 132.83.

USD/JPY Daily Chart

USD/JPY Daily chart

USD/JPY

Overview
Today last price134.77
Today Daily Change0.49
Today Daily Change %0.36
Today daily open134.28
 
Trends
Daily SMA20134.28
Daily SMA50133.92
Daily SMA100132.86
Daily SMA200136.98
 
Levels
Previous Daily High134.88
Previous Daily Low133.5
Previous Weekly High136.56
Previous Weekly Low133.01
Previous Monthly High136.56
Previous Monthly Low130.63
Daily Fibonacci 38.2%134.03
Daily Fibonacci 61.8%134.35
Daily Pivot Point S1133.56
Daily Pivot Point S2132.84
Daily Pivot Point S3132.19
Daily Pivot Point R1134.94
Daily Pivot Point R2135.6
Daily Pivot Point R3136.31

Author

Christian Borjon Valencia

Markets analyst, news editor, and trading instructor with over 14 years of experience across FX, commodities, US equity indices, and global macro markets.

More from Christian Borjon Valencia
Share:

Editor's Picks

EUR/USD flirts with daily highs, retargets 1.1900

EUR/USD regains upside traction, returning to the 1.1880 zone and refocusing its attention to the key 1.1900 barrier. The pair’s slight gains comes against the backdrop of a humble decline in the US Dollar as investors continue to assess the latest US CPI readings and the potential Fed’s rate path.

GBP/USD remains well bid around 1.3650

GBP/USD maintains its upside momentum in place, hovering around daily highs near 1.3650 and setting aside part of the recent three-day drop. Cable’s improved sentiment comes on the back of the Greenback’s  irresolute price action, while recent hawkish comments from the BoE’s Pill also collaborate with the uptick.

Gold clings to gains just above $5,000/oz

Gold is reclaiming part of the ground lost on Wednesday’s marked decline, as bargain-hunters keep piling up and lifting prices past the key $5,000 per troy ounce. The precious metal’s move higher is also underpinned by the slight pullback in the US Dollar and declining US Treasury yields across the curve.

Crypto Today: Bitcoin, Ethereum, XRP in choppy price action, weighed down by falling institutional interest 

Bitcoin's upside remains largely constrained amid weak technicals and declining institutional interest. Ethereum trades sideways above $1,900 support with the upside capped below $2,000 amid ETF outflows.

Week ahead – Data blitz, Fed Minutes and RBNZ decision in the spotlight

US GDP and PCE inflation are main highlights, plus the Fed minutes. UK and Japan have busy calendars too with focus on CPI. Flash PMIs for February will also be doing the rounds. RBNZ meets, is unlikely to follow RBA’s hawkish path.

Ripple Price Forecast: XRP potential bottom could be in sight

Ripple edges up above the intraday low of $1.35 at the time of writing on Friday amid mixed price actions across the crypto market. The remittance token failed to hold support at $1.40 the previous day, reflecting risk-off sentiment amid a decline in retail and institutional sentiment.