USD/JPY Price Analysis: Struggles at key resistance, slumps below 161.00
- USD/JPY consolidates with technical indicators suggesting a range-bound movement between 160.00 and 162.00.
- Potential Japanese intervention in FX markets looms, deterring aggressive buyers.
- A break above 161.00 could target YTD high of 161.95, while support lies at 160.22, with further downside risks to 158.25.

The USD/JPY consolidates below the psychological 161.00 figure as US Treasury bond yields edge lower and the Greenback weakens. The traders focus on Fed Chair Jerome Powell's semi-annual testimony at the US Congress and the release of US inflation figures. The major trades at 160.79, virtually unchanged.
USD/JPY Price Analysis: Technical outlook
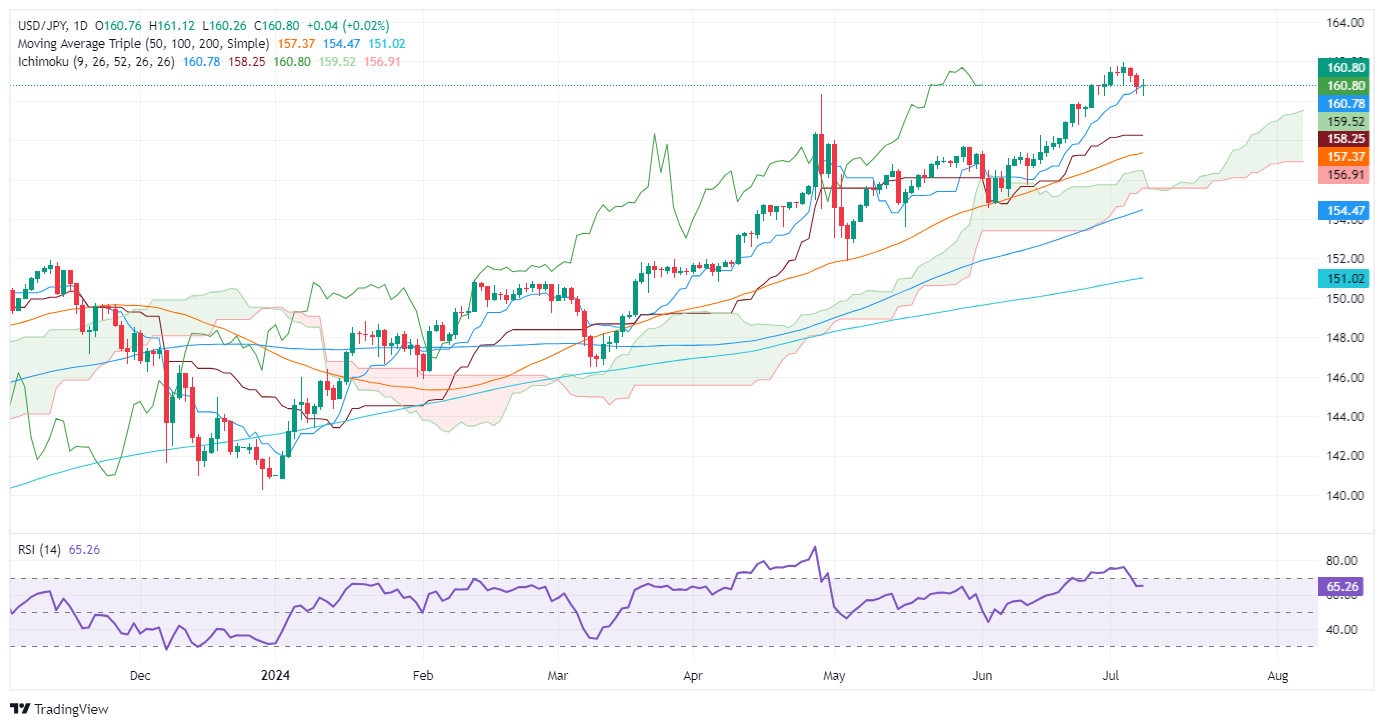
The USD/JPY daily chart is set to continue to trend higher from a price action standpoint, but fears of intervention by Japanese authorities in the FX markets might dent buyers from pushing the exchange rate higher.
Momentum suggests the pair would consolidate within the 160.00-162.00 range, as the Relative Strength Index (RSI) remains flat in bullish territory.
If USD/JPY buyers reclaim 161.00, that could exacerbate an upward move toward the year-to-date (YTD) high of 161.95. Further gains are seen above 162.00, at around the November 1986 high of 164.87.
Conversely, if the major slumps below the April 29 high at 160.22, the next support would be the Senkou Span A at 159.68. A breach of the latter and the pair will test the Kijun-Sen at 158.25, ahead of the Senkou Span B at 156.91.
USD/JPY Price Action – Daily Chart
Japanese Yen PRICE Today
The table below shows the percentage change of Japanese Yen (JPY) against listed major currencies today. Japanese Yen was the strongest against the US Dollar.
| USD | EUR | GBP | JPY | CAD | AUD | NZD | CHF | |
|---|---|---|---|---|---|---|---|---|
| USD | -0.00% | -0.01% | -0.03% | -0.01% | -0.04% | -0.04% | -0.02% | |
| EUR | 0.00% | -0.04% | -0.02% | -0.02% | -0.03% | -0.01% | -0.02% | |
| GBP | 0.01% | 0.04% | 0.02% | 0.02% | 0.02% | 0.02% | 0.01% | |
| JPY | 0.03% | 0.02% | -0.02% | 0.02% | -0.02% | -0.03% | 0.02% | |
| CAD | 0.01% | 0.02% | -0.02% | -0.02% | -0.04% | -0.01% | -0.02% | |
| AUD | 0.04% | 0.03% | -0.02% | 0.02% | 0.04% | -0.02% | -0.01% | |
| NZD | 0.04% | 0.01% | -0.02% | 0.03% | 0.01% | 0.02% | 0.02% | |
| CHF | 0.02% | 0.02% | -0.01% | -0.02% | 0.02% | 0.00% | -0.02% |
The heat map shows percentage changes of major currencies against each other. The base currency is picked from the left column, while the quote currency is picked from the top row. For example, if you pick the Japanese Yen from the left column and move along the horizontal line to the US Dollar, the percentage change displayed in the box will represent JPY (base)/USD (quote).
Author

Christian Borjon Valencia
FXStreet
Markets analyst, news editor, and trading instructor with over 14 years of experience across FX, commodities, US equity indices, and global macro markets.


