|

USD/JPY Price Analysis: Snaps two-day uptrned near 136.00 on breaking immediate support

  • USD/JPY remains pressured around intraday low as it reverses from two-week-old horizontal resistance.
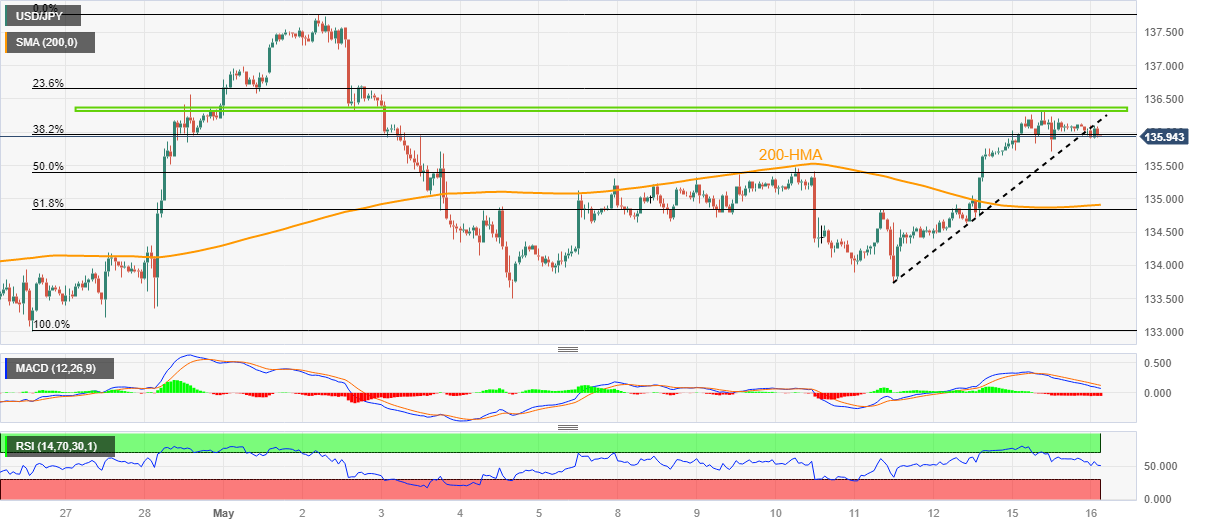
  • Downside break of ascending trend line from Thursday, bearish MACD signals favor Yen pair seller.
  • 200-HMA appears the key hurdle for the Yen buyers to crack and retake control.

USD/JPY recalls the sellers after their two-day absence as the Yen pair drops to 135.95 during early Tuesday. In doing so, the Yen pair take a U-turn from a fortnight-long horizontal resistance, as well as break a three-day-old ascending support line, now immediate resistance.

In addition to the pullback from a short-term key resistance and a downside break of the nearby support trend line, the bearish MACD signals and a downward-sloping RSI (14) line, not oversold, also keep the Yen buyers hopeful.

With this, the USD/JPY pair appears all set to test the 50% Fibonacci retracement level of its April 26 to May 02 upside, near 135.40.

However, a convergence of the 61.8% Fibonacci retracement and the 200-Hourly Moving Average (HMA), near 134.90-85, appears a tough nut to crack for the Yen pair sellers.

Following that, the 134.00 round figure and the monthly low of around 133.50 will gain the USD/JPY seller’s attention.

On the contrary, USD/JPY recovery remains elusive unless breaking a horizontal resistance area comprising tops marked since April 28, close to 136.30-35.

Even if the Yen pair buyers manage to keep the reins past 136.35, the tops marked in May and March, respectively near 137.80 and 137.90, may prod the bulls before directing them to the 138.00 round figure.

USD/JPY: Hourly chart

Trend: Further downside expected

Additional important levels

Overview
Today last price135.95
Today Daily Change-0.17
Today Daily Change %-0.12%
Today daily open136.12
 
Trends
Daily SMA20134.89
Daily SMA50133.76
Daily SMA100132.95
Daily SMA200137.04
 
Levels
Previous Daily High136.32
Previous Daily Low135.65
Previous Weekly High135.77
Previous Weekly Low133.74
Previous Monthly High136.56
Previous Monthly Low130.63
Daily Fibonacci 38.2%136.07
Daily Fibonacci 61.8%135.91
Daily Pivot Point S1135.74
Daily Pivot Point S2135.36
Daily Pivot Point S3135.07
Daily Pivot Point R1136.41
Daily Pivot Point R2136.7
Daily Pivot Point R3137.08

Author

Anil Panchal

Anil Panchal

FXStreet

Anil Panchal has nearly 15 years of experience in tracking financial markets. With a keen interest in macroeconomics, Anil aptly tracks global news/updates and stays well-informed about the global financial moves and their implications.

More from Anil Panchal
Share:

Markets move fast. We move first.

Orange Juice Newsletter brings you expert driven insights - not headlines. Every day on your inbox.

By subscribing you agree to our Terms and conditions.

Editor's Picks

EUR/USD rebounds after falling toward 1.1700

EUR/USD gains traction and trades above 1.1730 in the American session, looking to end the week virtually unchanged. The bullish opening in Wall Street makes it difficult for the US Dollar to preserve its recovery momentum and helps the pair rebound heading into the weekend.

GBP/USD steadies below 1.3400 as traders assess BoE policy outlook

Following Thursday's volatile session, GBP/USD moves sideways below 1.3400 on Friday. Investors reassess the Bank of England's policy oıtlook after the MPC decided to cut the interest rate by 25 bps by a slim margin. Meanwhile, the improving risk mood helps the pair hold its ground.

Gold stays below $4,350, looks to post small weekly gains

Gold struggles to gather recovery momentum and stays below $4,350 in the second half of the day on Friday, as the benchmark 10-year US Treasury bond yield edges higher. Nevertheless, the precious metal remains on track to end the week with modest gains as markets gear up for the holiday season.

Crypto Today: Bitcoin, Ethereum, XRP rebound amid bearish market conditions

Bitcoin (BTC) is edging higher, trading above $88,000 at the time of writing on Monday. Altcoins, including Ethereum (ETH) and Ripple (XRP), are following in BTC’s footsteps, experiencing relief rebounds following a volatile week.

How much can one month of soft inflation change the Fed’s mind?

One month of softer inflation data is rarely enough to shift Federal Reserve policy on its own, but in a market highly sensitive to every data point, even a single reading can reshape expectations. November’s inflation report offered a welcome sign of cooling price pressures. 

XRP rebounds amid ETF inflows and declining retail demand demand

XRP rebounds as bulls target a short-term breakout above $2.00 on Friday. XRP ETFs record the highest inflow since December 8, signaling growing institutional appetite.