|

USD/JPY Price Analysis: Seesaws around 132.80s, after losing more than 200 pips

  • On Wednesday, the USD/JPY slide more than 1.50%, its largest daily loss since July 28.
  • USD/JPY buyers unable to break above 135.30 exacerbated the fall below the 133.00 mark.

The USD/JPY tanked more than 200 pips on Wednesday, courtesy of cooler-than-expected US CPI data, suggesting that the Federal Reserve might pivot, towards a dovish stance, spurring a risk-on impulse, with Wall Street’s recording substantial gains while the greenback weakened. However, as Thursday’s Asian Pacific session begins, the USD/JPY is trading at 132.85, further extending its weekly losses.

USD/JPY Price Analysis: Technical outlook

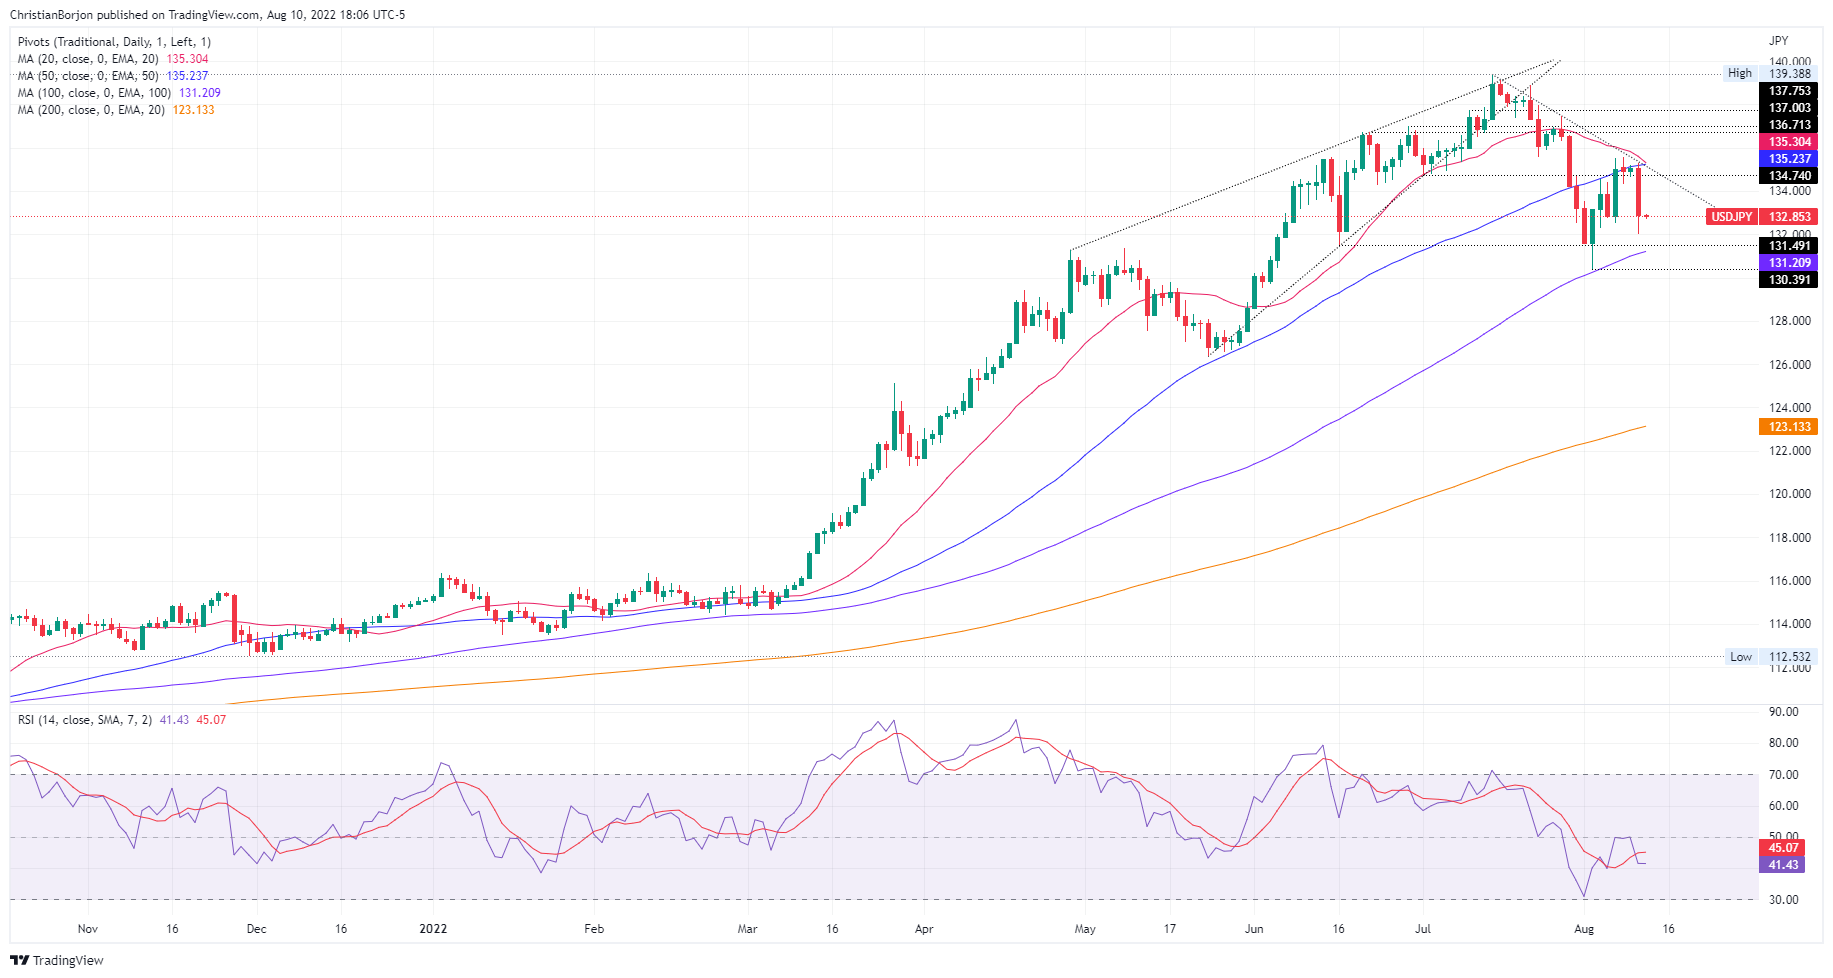
On Wednesday, the USD/JPY faced the confluence of three-technical signals above the exchange rate, which was the USD/JPY’s first resistance level. The convergence of the 20, 50-DMAs and a one-month-old downslope trendline around the 135.20-30 area was challenging to break. Nevertheless, Wednesday’s fall is attributed to US economic data releases. Still, the previously mentioned confluence of technical signals played its role for the last four days, with buyers unable to crack it. Therefore, the USD/JPY shifted its bias from neutral-upwards to neutral.

USD/JPY traders should notice that the Relative Strength Index is in bearish territory, indicating that sellers are gathering momentum. Unless buyers reclaim the 135.50 area, even though the pair is neutral, it is tilted to the downside.

Therefore, the USD/JPY’s first support will be the August 10 low at 132.03. Break below will expose the 100-day EMA at 131.20, the August 2 swing low at 131.20, and the psychological 130.00 figure.

USD/JPY Daily chart

USD/JPY Key Technical Levels

USD/JPY

Overview
Today last price132.85
Today Daily Change-2.17
Today Daily Change %-1.61
Today daily open135.02
 
Trends
Daily SMA20135.86
Daily SMA50135.15
Daily SMA100131.01
Daily SMA200122.97
 
Levels
Previous Daily High135.2
Previous Daily Low134.67
Previous Weekly High135.5
Previous Weekly Low130.4
Previous Monthly High139.39
Previous Monthly Low132.5
Daily Fibonacci 38.2%135
Daily Fibonacci 61.8%134.87
Daily Pivot Point S1134.72
Daily Pivot Point S2134.43
Daily Pivot Point S3134.19
Daily Pivot Point R1135.26
Daily Pivot Point R2135.5
Daily Pivot Point R3135.79

Author

Christian Borjon Valencia

Christian Borjon began his career as a retail trader in 2010, mainly focused on technical analysis and strategies around it. He started as a swing trader, as he used to work in another industry unrelated to the financial markets.

More from Christian Borjon Valencia
Share:

Markets move fast. We move first.

Orange Juice Newsletter brings you expert driven insights - not headlines. Every day on your inbox.

By subscribing you agree to our Terms and conditions.

Editor's Picks

EUR/USD recovers to 1.1750 region as 2025 draws to a close

Following the bearish action seen in the European session on Wednesday, EUR/USD regains its traction and recovery to the 1.1750 region. Nevertheless, the pair's volatility remains low as trading conditions thin out on the last day of the year.

GBP/USD stays weak near 1.3450 on modest USD recovery

GBP/USD remains under modest beairsh pressure and fluctuates at around 1.3450 on Wednesday. The US Dollar finds fresh demand due to the end-of-the-year position adjustments, weighing on the pair amid the pre-New Year trading lull. 

Gold climbs to near $4,350 on Fed rate cut bets, geopolitical risks

Gold price rises to near $4,345 during the early Asian session on Friday. Gold finished 2025 with a significant rally, achieving an annual gain of around 65%, its biggest annual gain since 1979. The rally of the precious metal is bolstered by the prospect of further US interest rate cuts in 2026 and safe-haven flows.

Bitcoin, Ethereum and XRP prepare for a potential New Year rebound

Bitcoin, Ethereum, and Ripple are holding steady on Wednesday after recording minor gains on the previous day. Technically, Bitcoin could extend gains within a triangle pattern while Ethereum and Ripple face critical overhead resistance. 

Economic outlook 2026-2027 in advanced countries: Solidity test

After a year marked by global economic resilience and ending on a note of optimism, 2026 looks promising and could be a year of solid economic performance. In our baseline scenario, we expect most of the supportive factors at work in 2025 to continue to play a role in 2026.

Crypto market outlook for 2026

Year 2025 was volatile, as crypto often is.  Among positive catalysts were favourable regulatory changes in the U.S., rise of Digital Asset Treasuries (DAT), adoption of AI and tokenization of Real-World-Assets (RWA).