|

USD/JPY Price Analysis: Retraces from YTD highs to 115.80s post-US CPI release

  • The USD/JPY rallied towards 116.33, but USD bulls failed to sustain the rally, eases to high 115.00s.
  • US Treasury yields advance, but the greenback bucks the trend, as it falls 0.10% during the day.
  • USD/JPY keeps upward biased, confirmed by the upbreak of a month-old trendline.

Following the US inflation report that showed that prices rose by 7.5% y/y in January, the USD/JPY advances 0.31% in the North American session. At the time of writing, the USD/JPY is trading at 115.86.

The financial market mood dampened as the New York session progressed. US equity indices are recording losses after the US Labor Department noted that the Consumer Price Index (CPI) increased to levels last seen in August 1982. The core CPI reading, which excludes volatile items like food and energy,  expanded above the 6% threshold (y/y), a tenth higher of expectations.

The US Dollar Index, a gauge of the greenback’s performance against a basket of six currencies, edges lower 0.10%, sitting at 95.40, failing to track the rise of US Treasuries, led by the 10-year benchmark note, sitting at 2.012%, gaining seven basis points.

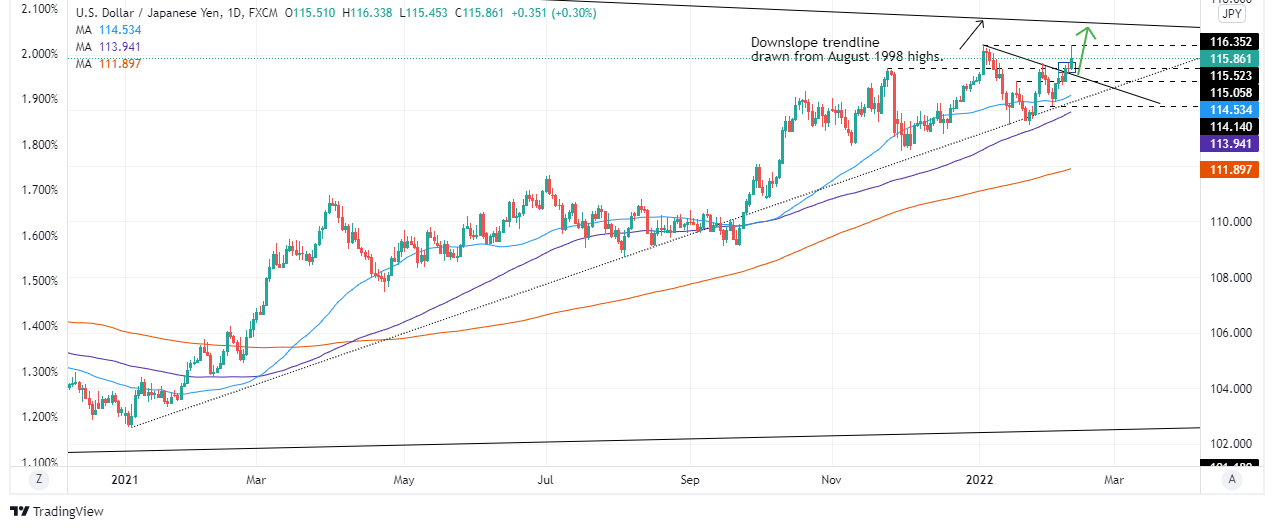
USD/JPY Price Forecasts: Technical outlook

The USD/JPY keeps the upward bias intact. The upbreak of a one-month-old trendline accelerated the move towards 116.00, which was broken after the release of US CPI, though it fell short of piercing the YTD high at 116.35. 

As USD bulls take a breather, after a steeper trip over 116.00, the USD/JPY sits comfortably above November 24, 2021, daily high at 115.52. That said, the USD/JPY first resistance would be 116.0. Breach of the latter would expose the YTD high at 116.35, followed by a challenge of a 24-month-old downslope trendline around 117.00. A clear break of that ceiling level would pave the way towards January 2017 swing high at 118.61.

USD/JPY

Overview
Today last price115.86
Today Daily Change0.34
Today Daily Change %0.29
Today daily open115.52
 
Trends
Daily SMA20114.67
Daily SMA50114.5
Daily SMA100113.9
Daily SMA200111.88
 
Levels
Previous Daily High115.68
Previous Daily Low115.32
Previous Weekly High115.59
Previous Weekly Low114.16
Previous Monthly High116.35
Previous Monthly Low113.47
Daily Fibonacci 38.2%115.46
Daily Fibonacci 61.8%115.54
Daily Pivot Point S1115.34
Daily Pivot Point S2115.15
Daily Pivot Point S3114.98
Daily Pivot Point R1115.7
Daily Pivot Point R2115.87
Daily Pivot Point R3116.06

Author

Christian Borjon Valencia

Markets analyst, news editor, and trading instructor with over 14 years of experience across FX, commodities, US equity indices, and global macro markets.

More from Christian Borjon Valencia
Share:

Editor's Picks

EUR/USD faces some resistance near 100-SMA on H4, around 1.1830 zone

The EUR/USD pair gains some follow-through positive traction for the second consecutive day and climbs to the 1.1830 region during the Asian session on Thursday. The US Dollar remains on the back foot amid concerns about the economic fallout from US President Donald Trump's erratic trade policies and acts as a tailwind for spot prices.

GBP/USD extends recovery to near 20-day EMA as US Dollar weakens

The Pound Sterling holds onto weekly gains around 1.3565 against the US Dollar during the Asian trading session on Thursday. The GBP/USD pair trades firmly as the US Dollar remains under pressure due to uncertainty surrounding the United States trade policy outlook.

Gold struggle with $5,200 extends ahead of more US-Iran talks

Gold is replicating the recovery moves seen in Wednesday’s Asian trading early Thursday, as buyers continue to flirt with the $5,200 level. Sustained US Dollar weakness and looming US-Iran talks aid the bright metal’s rebound.  

Top Crypto Gainers: Polkadot, Near Protocol, Uniswap lead market rebound

Altcoins, such as Polkadot, Near Protocol, and Uniswap, are leading gains over the last 24 hours as Bitcoin jumped 6% on Wednesday. The altcoins are holding steady at press time on Thursday following a rebound the previous day, testing the waters around their 50-day Exponential Moving Average. 

Nvidia delivers another monster earnings report, and forecasts big things to come

It was another monster earnings report from Nvidia for fiscal Q4. Revenues were $68.1bn, smashing estimates of $65bn. Gross profit margin was a healthy 75%, up from 73.5% in the prior quarter, and the outlook for this quarter was monstrous.

Cosmos Hub Price Forecast: ATOM rebounds slightly, bearish outlook remains intact

Cosmos Hub (ATOM) price rebounds, trading above $2.05 at the time of writing on Wednesday, after undergoing a sharp correction since last week. Weakening on-chain and derivatives data support a bearish outlook, while technical analysis remains unfavorable.