|

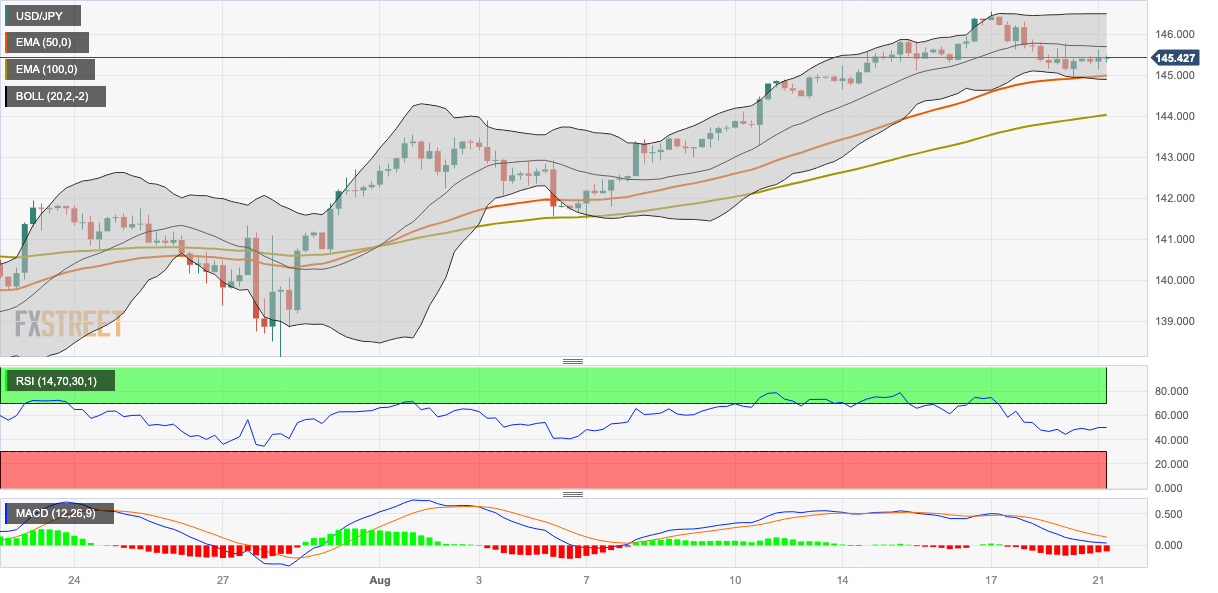
USD/JPY Price Analysis: Remains confined around 145.40 amid the cautious mood

  • USD/JPY consolidates around the 145.15-145.65 region in a narrow trading band.
  • The major pair stands above the 50- and 100-hour EMAs with an upward slope.
  • The immediate resistance level appears at 145.85; he key contention level is seen at 144.90-145.00 region.

The USD/JPY pair oscillates in a narrow range below the mid-145.00s heading into the early Asian session on Monday. Traders prefer to wait on the sidelines amid the risk-averse mood and await the Federal Reserve (Fed) Chairman Jerome Powell Speaks at the Jackson Hole Symposium on Friday. The major pair currently trades near 145.43, gaining 0.03% on the day.

Meanwhile, traders will keep an eye on the potential intervention by the Bank of Japan (BoJ). The Japanese government may step in to prevent the Japanese Yen. However, the monetary policy differential between the US and Japan is the main driver of the Yen's weakening.

According to the four-hour chart, the USD/JPY pair stands above the 50- and 100-hour Exponential Moving Averages (EMAs) with an upward slope, which means the path of least resistance is to the upside for the major pair.

That said, the key contention level for the major pair is seen at the 144.90-145.00 region, representing a confluence of the lower limit of the Bollinger Band and 100-hour EMA. The additional downside filter is seen at 144.40 (low of August 11), followed by 144.00 (100-hour EMA), and finally at 143.30 (low of August 10).

On the upside, the immediate resistance level for USD/JPY appears at 145.85 (high of August 15). The critical barrier for the pair is seen at a YTD high and the boundary of the Bollinger Band of 146.55. Any meaningful follow-through buying above the latter would challenge a psychological round figure at 147.00, which will be a tough nut to crack for the USD/JPY pair.

It’s worth noting that the Relative Strength Index (RSI) stands below 50 and Moving Average Convergence/Divergence (MACD) stays in bearish territory, which indicates that the downside momentum has been activated for the time being.
 

USD/JPY four-hour chart

USD/JPY

Overview
Today last price145.43
Today Daily Change0.03
Today Daily Change %0.02
Today daily open145.4
 
Trends
Daily SMA20143.23
Daily SMA50142.32
Daily SMA100139.19
Daily SMA200136.53
 
Levels
Previous Daily High145.88
Previous Daily Low144.93
Previous Weekly High146.56
Previous Weekly Low144.65
Previous Monthly High144.91
Previous Monthly Low137.24
Daily Fibonacci 38.2%145.29
Daily Fibonacci 61.8%145.51
Daily Pivot Point S1144.93
Daily Pivot Point S2144.45
Daily Pivot Point S3143.98
Daily Pivot Point R1145.87
Daily Pivot Point R2146.35
Daily Pivot Point R3146.82

Author

Lallalit Srijandorn

Lallalit Srijandorn is a Parisian at heart. She has lived in France since 2019 and now becomes a digital entrepreneur based in Paris and Bangkok.

More from Lallalit Srijandorn
Share:

Markets move fast. We move first.

Orange Juice Newsletter brings you expert driven insights - not headlines. Every day on your inbox.

By subscribing you agree to our Terms and conditions.

Editor's Picks

EUR/USD eases to near 1.1650, eyes US PCE for fresh impetus

EUR/USD turns south to test 1.1650 in European trading on Friday, facing rejection once again near seven-week highs. The pair, however, continues to draw support from persistent US Dollar selling bias, despite a cautious market mood. Traders now await the US September PCE inflation and UoM Consumer Sentiment data. 

GBP/USD holds gains near 1.3350 ahead of US data

GBP/USD sticks to a positive bias near 1.3350 in the European session on Friday. Traders prefer to wait on the sidelines ahead of the key US inflation and sentiment data due later in the day. In the meantime, broad-based US Dollar weakness helps the pair stay afloat. 

Gold remains below $4,250 barrier as traders await US PCE data for directional impetus

Gold gains some positive traction on Friday, though it remains confined in the weekly range. Dovish Fed expectations continue to undermine the USD and lend support to the commodity. Bulls, however, might opt to wait for the US PCE Price Index before placing aggressive bets.

Pi Network: Bearish streak nears critical support trendline

Pi Network edges lower on Friday for the third consecutive day, approaching a local support trendline. The on-chain data suggests an increase in supply pressure as Centralized Exchanges experience a surge in inflows. Technically, the pullback in PI risks further losses, as the Moving Average Convergence Divergence indicator is flashing a sell signal. 

Canada Unemployment Rate expected to edge higher in November ahead of BoC rate decision

Statistics Canada will release its Labour Force Survey on Friday, and markets are bracing for a weak print. The Unemployment Rate is expected to tick higher to 7% in November, while the Employment Change is forecast to come in flat after a nice gain in October.

Pi Network Price Forecast: Bearish streak nears critical support trendline

Pi Network (PI) edges lower on Friday for the third consecutive day, approaching a local support trendline. The on-chain data suggests an increase in supply pressure as Centralized Exchanges (CEXs) experience a surge in inflows.