USD/JPY Price Analysis: Recovers early lost ground, struggles to capitalize on move beyond 149.00
- USD/JPY catches fresh bids following an intraday dip to 148.25, albeit lacks follow-through.
- Intervention fears turn out to be the only factor holding back bulls from placing fresh bets.
- The technical setup suggests that the path of least resistance for the pair is to the upside.

The USD/JPY pair attracts some dip-buying following an intraday slide to the 148.25 region on Thursday and climbs to the top end of its daily range during the first half of the European session. Spot prices currently trade around the 149.00 mark, though lack follow-through in the wake of speculations that Japanese authorities will intervene in the FX market to defend the domestic currency.
The initial market reaction to Wednesday's rather unimpressive US macro data, meanwhile, turns out to be short-lived amid firming expectations that the Federal Reserve (Fed) will keep interest rates higher for longer. This, in turn, triggers a fresh leg up in the US Treasury bond yields, which assists the US Dollar (USD) to stall its corrective slide from an 11-month peak and acts as a tailwind for the USD/JPY pair.
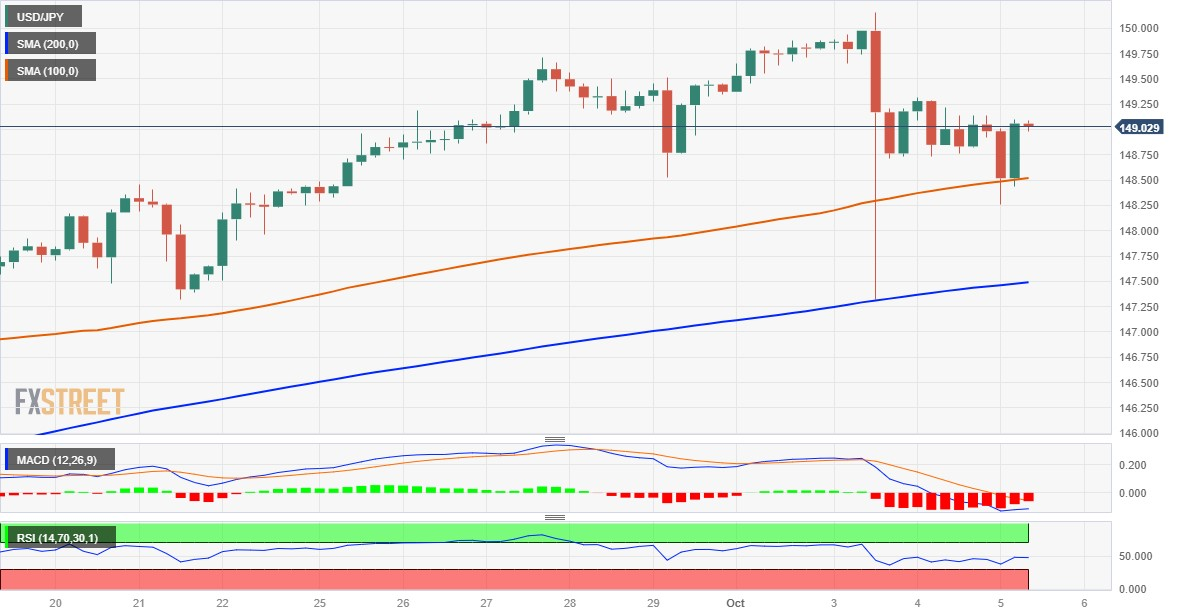
From a technical perspective, the intraday decline showed some resilience below the 100-period Simple Moving Average (SMA) on the 4-hour chart. This comes on the back of a solid rebound from the 200-period SMA on the 4-hour chart, around the 147.30 area, or the lowest level since September 14 touched on Tuesday, and supports prospects for a further near-term appreciating move for the USD/JPY pair.
Moreover, oscillators on the daily chart – though have been retreating recently – are still holding comfortably in the positive territory. This, in turn, favours bullish traders and suggests that the path of least resistance for the USD/JPY pair is to the upside. Any subsequent move up, however, might confront some barrier near the 149.60 area, above which bulls might aim back to challenge the 150.00 intervention level.
The latter should act as a key pivotal point for short-term traders, which if cleared decisively will confirm a fresh breakout and pave the way for an extension of the recent well-established uptrend witnessed over the past two months or so. The subsequent move up has the potential to lift the USD/JPY pair towards the 151.00 mark en route to a multi-decade higher, closer to the 152.00 mark touched in October 2022.
On the flip side, the daily swing low, around the 148.25 region, now seems to protect the immediate downside ahead of the 148.00 mark. Failure to defend the said support levels might prompt some technical selling and drag the USD/JPY pair back towards the weekly trough, around the 147.30 region. This is followed by the 147.00 round figure, which if broken will suggest that spot prices have topped out in the near term.
USD/JPY 4-hour chart
Technical levels to watch
Author

Haresh Menghani
FXStreet
Haresh Menghani is a detail-oriented professional with 10+ years of extensive experience in analysing the global financial markets.


