• USD/JPY marches firmly above 144.30, up by 0.16%.
  • During the week, the USD/JPY has been unable to break the BoJ’s line on the sand at 145.00.
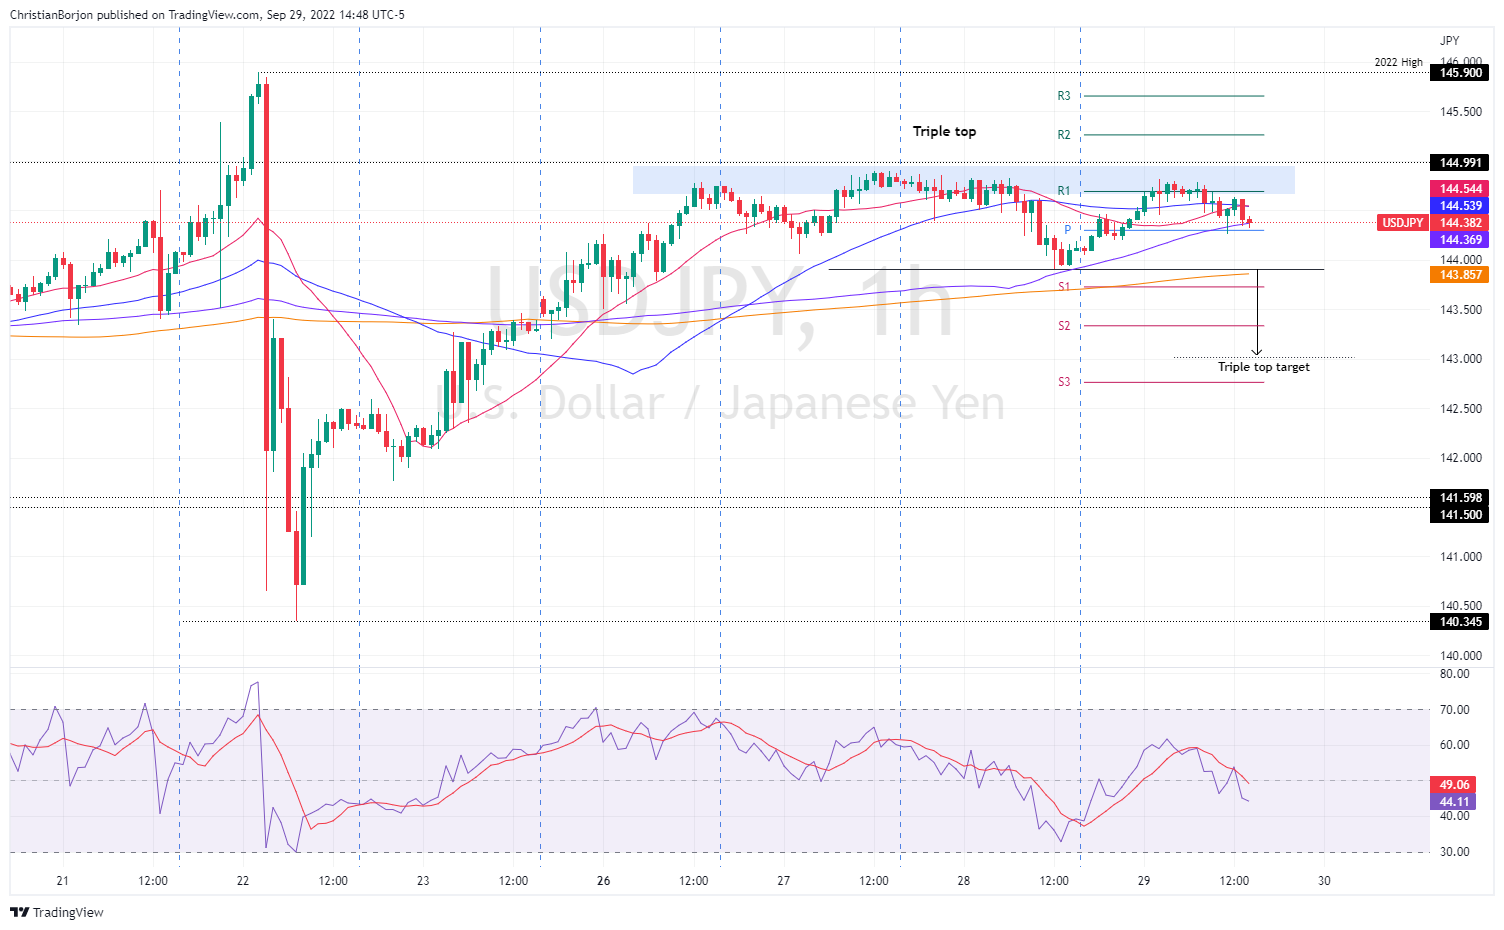
  • The USD/JPY one-hour chart depicts the formation of a triple top, targeting a fall towards 143.00.

The USD/JPY is recouping on Thursday, following 0.47% Wednesday losses, courtesy of falling US Treasury bond yields, which weighed on the greenback. However, fundamental factors like US central bank officials reiterating the need for higher rates to tame inflation bolstered the USD/JPY. Therefore, the USD/JPY st trading at 144.37, above its opening price by 0.18%.

USD/JPY Price Analysis: Technical outlook

The USD/JPY has been unable to break above/below the September 22 Bank of Japan intervention in the Forex markets, with price action staying in the 140.34-145.90 range. Even though the weekly high meandered ten pips shy of the 145.00 figure, traders remain nervous about another BoJ incursion in the FX space. Worth noting that the USD/JPY is trading sideways while the Relative Strength Index (RSI) keeps heading south. Therefore, the likelihood of a test of the 20-day EMA ar 143.27 is on the cards.

The one-hour chart portrays the USD/JPY as neutral-to-downward biased. At the time of writing, the USD/JPY is testing the 100-EMA, which, once broken, could pave the way towards 143.90, the September 28 daily low. Once cleared, the next support would be the 200-EMA at 143.85, followed by the S1 daily pivot at 143.72, ahead of the triple top target at 143.00.

Contrarily, if the USD/JPY clears the 145.00 figure, expect a re-test of the YTD high at 145.90 unless Japanese authorities re-enter the markets.

USD/JPY Key Technical Levels

USD/JPY

Overview
Today last price 144.38
Today Daily Change 0.16
Today Daily Change % 0.11
Today daily open 144.22
 
Trends
Daily SMA20 143.07
Daily SMA50 138.52
Daily SMA100 135.88
Daily SMA200 127.67
 
Levels
Previous Daily High 144.87
Previous Daily Low 143.91
Previous Weekly High 145.9
Previous Weekly Low 140.35
Previous Monthly High 139.08
Previous Monthly Low 130.4
Daily Fibonacci 38.2% 144.28
Daily Fibonacci 61.8% 144.5
Daily Pivot Point S1 143.79
Daily Pivot Point S2 143.37
Daily Pivot Point S3 142.83
Daily Pivot Point R1 144.76
Daily Pivot Point R2 145.3
Daily Pivot Point R3 145.72


Share: Feed news

Information on these pages contains forward-looking statements that involve risks and uncertainties. Markets and instruments profiled on this page are for informational purposes only and should not in any way come across as a recommendation to buy or sell in these assets. You should do your own thorough research before making any investment decisions. FXStreet does not in any way guarantee that this information is free from mistakes, errors, or material misstatements. It also does not guarantee that this information is of a timely nature. Investing in Open Markets involves a great deal of risk, including the loss of all or a portion of your investment, as well as emotional distress. All risks, losses and costs associated with investing, including total loss of principal, are your responsibility. The views and opinions expressed in this article are those of the authors and do not necessarily reflect the official policy or position of FXStreet nor its advertisers. The author will not be held responsible for information that is found at the end of links posted on this page.

If not otherwise explicitly mentioned in the body of the article, at the time of writing, the author has no position in any stock mentioned in this article and no business relationship with any company mentioned. The author has not received compensation for writing this article, other than from FXStreet.

FXStreet and the author do not provide personalized recommendations. The author makes no representations as to the accuracy, completeness, or suitability of this information. FXStreet and the author will not be liable for any errors, omissions or any losses, injuries or damages arising from this information and its display or use. Errors and omissions excepted.

The author and FXStreet are not registered investment advisors and nothing in this article is intended to be investment advice.

Recommended content


Recommended content

Editors’ Picks

EUR/USD regains traction, recovers above 1.0700

EUR/USD regains traction, recovers above 1.0700

EUR/USD regained its traction and turned positive on the day above 1.0700 in the American session. The US Dollar struggles to preserve its strength after the data from the US showed that the economy grew at a softer pace than expected in Q1.

EUR/USD News

GBP/USD returns to 1.2500 area in volatile session

GBP/USD returns to 1.2500 area in volatile session

GBP/USD reversed its direction and recovered to 1.2500 after falling to the 1.2450 area earlier in the day. Although markets remain risk-averse, the US Dollar struggles to find demand following the disappointing GDP data.

GBP/USD News

Gold climbs above $2,340 following earlier drop

Gold climbs above $2,340 following earlier drop

Gold fell below $2,320 in the early American session as US yields shot higher after the data showed a significant increase in the US GDP price deflator in Q1. With safe-haven flows dominating the markets, however, XAU/USD reversed its direction and rose above $2,340.

Gold News

XRP extends its decline, crypto experts comment on Ripple stablecoin and benefits for XRP Ledger

XRP extends its decline, crypto experts comment on Ripple stablecoin and benefits for XRP Ledger

Ripple extends decline to $0.52 on Thursday, wipes out weekly gains. Crypto expert asks Ripple CTO how the stablecoin will benefit the XRP Ledger and native token XRP. 

Read more

After the US close, it’s the Tokyo CPI

After the US close, it’s the Tokyo CPI

After the US close, it’s the Tokyo CPI, a reliable indicator of the national number and then the BoJ policy announcement. Tokyo CPI ex food and energy in Japan was a rise to 2.90% in March from 2.50%.

Read more

Forex MAJORS

Cryptocurrencies

Signatures