|

USD/JPY Price Analysis: Rallies sharply towards 135.00 on buyers stepping in, eyeing the 20-DMA

  • The USD/JPY is soaring during the week by almost 1.50%.
  • A bullish-engulfing candle pattern in the daily chart opens the door for further gains.
  • In the near term, a pullback towards 134.00 is on the cards.

The USD/JPY rises for the third time during the week, reaching a fresh weekly high at 135.50, spurred by positive US jobs data released on Friday, which caused a knee-jerk reaction of almost 200 pips, from around 133.07 to its aforementioned weekly high. At 135.06, the USD/JPY gains 1.66%.

USD/JPY Price Analysis: Technical outlook

USD/JPY’s Friday price action shows that the major formed a huge bullish-engulfing candle pattern, meaning buying pressure is stepping in. At the same time, the exchange rate sits above the 50-day EMA at 134.84, which, decisively broken, could pave the way towards the 20-day EMA at 136.04. Worth noting that buyers are gathering momentum, as shown by the Relative Strength Index (RSI), about to cross the 50-central line, another reason for sellers to get out of the way once buyers have regained control.

Therefore, the USD/JPY’s first resistance would be the 135.00 figure, followed by the 20-day EMA at 136.04, and then the June 22 daily high at 136.71.
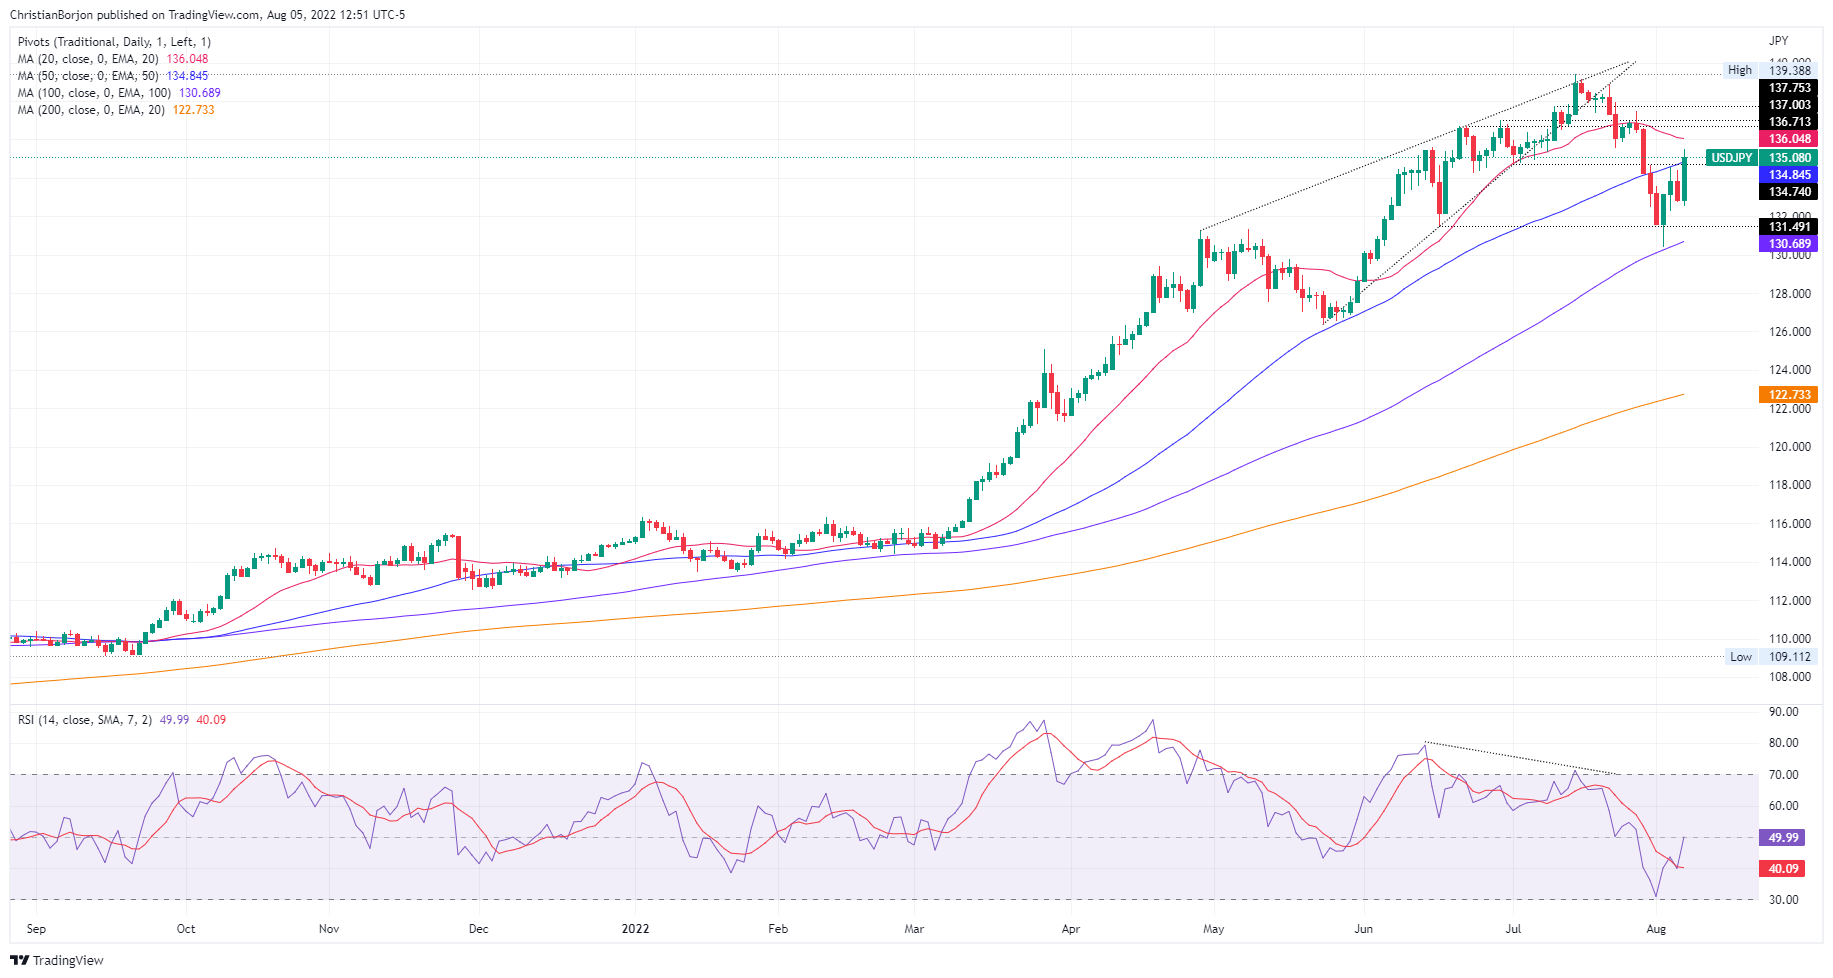
USD/JPY Daily Chart

Meanwhile, the USD/JPY hourly chart illustrates the major faced resistance near the R3 pivot at 135.60, dipping towards the R2 daily pivot point at 135.00, where bids keep the pair above the 135.00 figure. Nevertheless, the uptrend appears to be losing steam, as the Relative Strength Index reached overbought territory, meaning that buying pressure is easing, so a pullback towards the R1 daily pivot around 133.94 is on the cards.

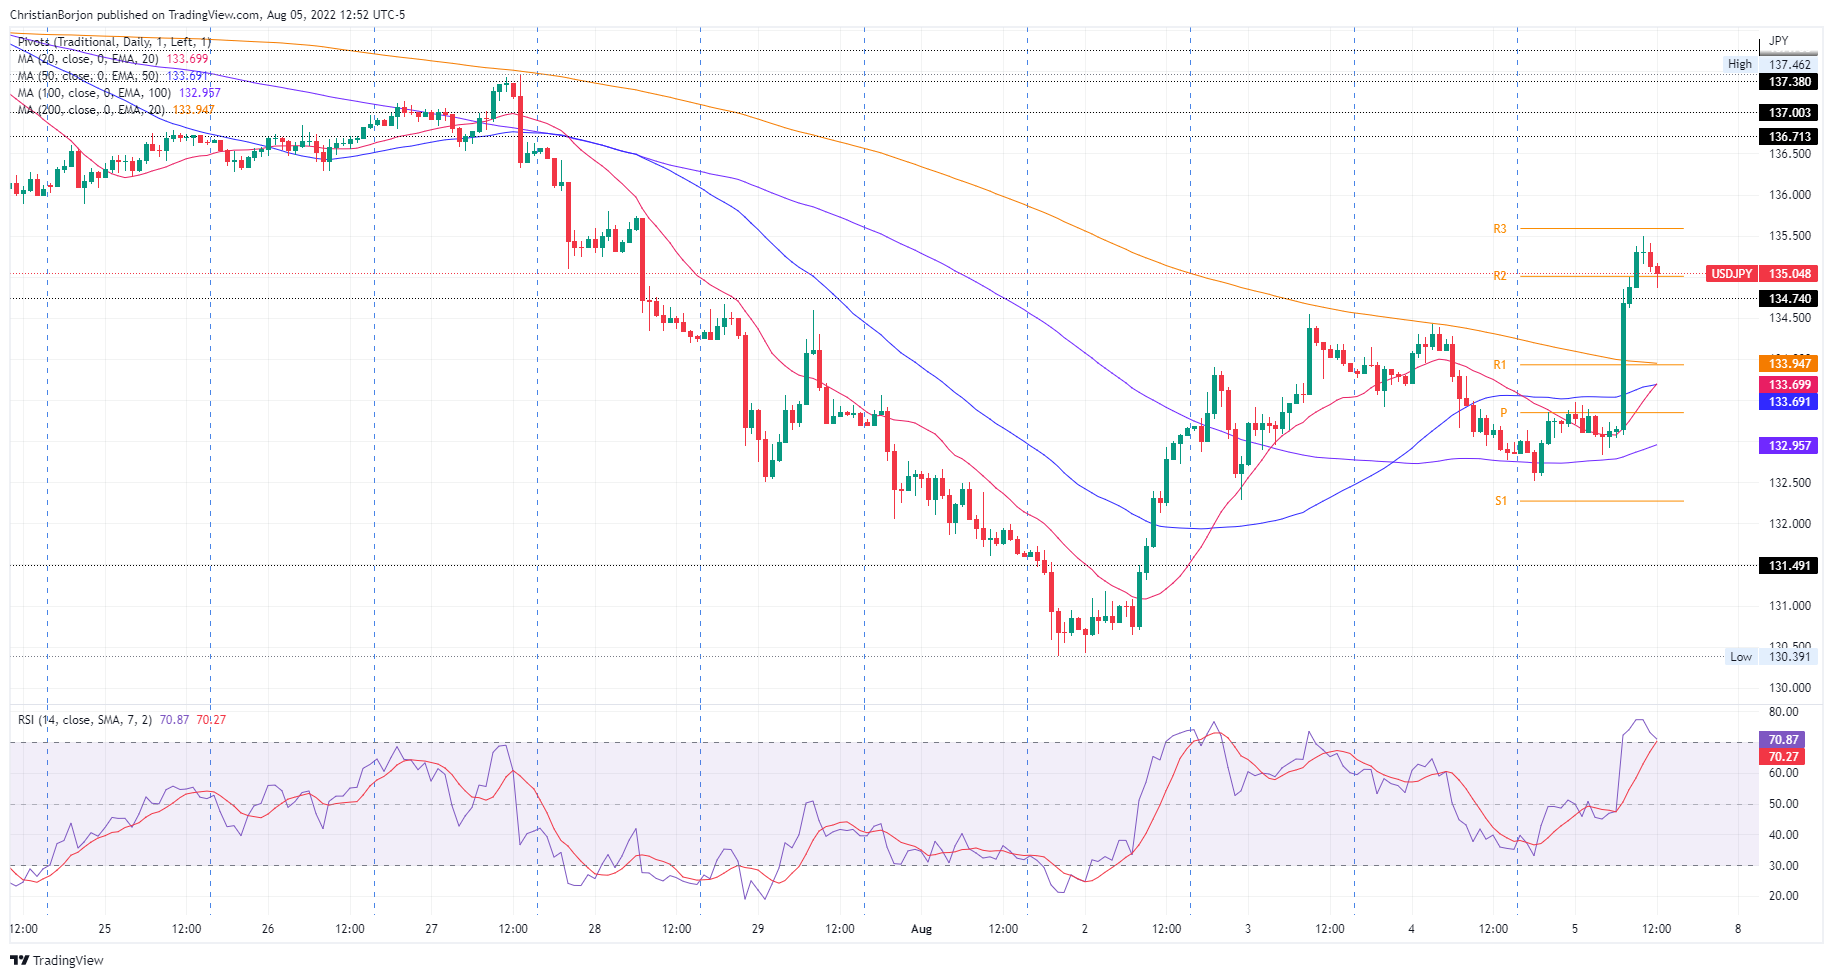
USD/JPY Hourly chart

 USD/JPY Key Technical Levels

USD/JPY

Overview
Today last price135.06
Today Daily Change1.79
Today Daily Change %1.35
Today daily open132.91
 
Trends
Daily SMA20136.12
Daily SMA50134.71
Daily SMA100130.56
Daily SMA200122.65
 
Levels
Previous Daily High134.42
Previous Daily Low132.76
Previous Weekly High137.46
Previous Weekly Low132.5
Previous Monthly High139.39
Previous Monthly Low132.5
Daily Fibonacci 38.2%133.4
Daily Fibonacci 61.8%133.79
Daily Pivot Point S1132.31
Daily Pivot Point S2131.71
Daily Pivot Point S3130.65
Daily Pivot Point R1133.97
Daily Pivot Point R2135.02
Daily Pivot Point R3135.63

Author

Christian Borjon Valencia

Christian Borjon began his career as a retail trader in 2010, mainly focused on technical analysis and strategies around it. He started as a swing trader, as he used to work in another industry unrelated to the financial markets.

More from Christian Borjon Valencia
Share:

Markets move fast. We move first.

Orange Juice Newsletter brings you expert driven insights - not headlines. Every day on your inbox.

By subscribing you agree to our Terms and conditions.

Editor's Picks

EUR/USD bounces toward 1.1750 as US Dollar loses strength

EUR/USD returned to the 1.1750 price zone in the American session on Friday, despite falling Wall Street, which indicates risk aversion. Trading conditions remain thin following the New Year holiday and ahead of the weekend, with the focus shifting to US employment and European data scheduled for next week.

GBP/USD nears 1.3500, holds within familiar levels

After testing 1.3400 on the last day of 2025, GBP/USD managed to stage a rebound. Nevertheless, the pair finds it difficult to gather momentum and trades with modest intraday gains at around 1.3490 as market participants remain in holiday mood.

Gold trims intraday gains, approaches $4,300

Gold retreated sharply from the $4,400  area and trades flat for the day in the $4,320 price zone. Choppy trading conditions exacerbated the intraday decline, although XAU/USD bearish case is out of the picture, considering growing expectations for a dovish Fed and persistent geopolitical tensions.

Cardano gains early New Year momentum, bulls target falling wedge breakout

Cardano kicks off the New Year on a positive note and is extending gains, trading above $0.36 at the time of writing on Friday. Improving on-chain and derivatives data point to growing bullish interest, while the technical outlook keeps an upside breakout in focus.

Economic outlook 2026-2027 in advanced countries: Solidity test

After a year marked by global economic resilience and ending on a note of optimism, 2026 looks promising and could be a year of solid economic performance. In our baseline scenario, we expect most of the supportive factors at work in 2025 to continue to play a role in 2026.

Crypto market outlook for 2026

Year 2025 was volatile, as crypto often is.  Among positive catalysts were favourable regulatory changes in the U.S., rise of Digital Asset Treasuries (DAT), adoption of AI and tokenization of Real-World-Assets (RWA).