|

USD/JPY Price Analysis: Justifies bear cross with mild losses near 134.00

  • USD/JPY retreats from intraday high, reverses the previous day’s bounce off one-month low.
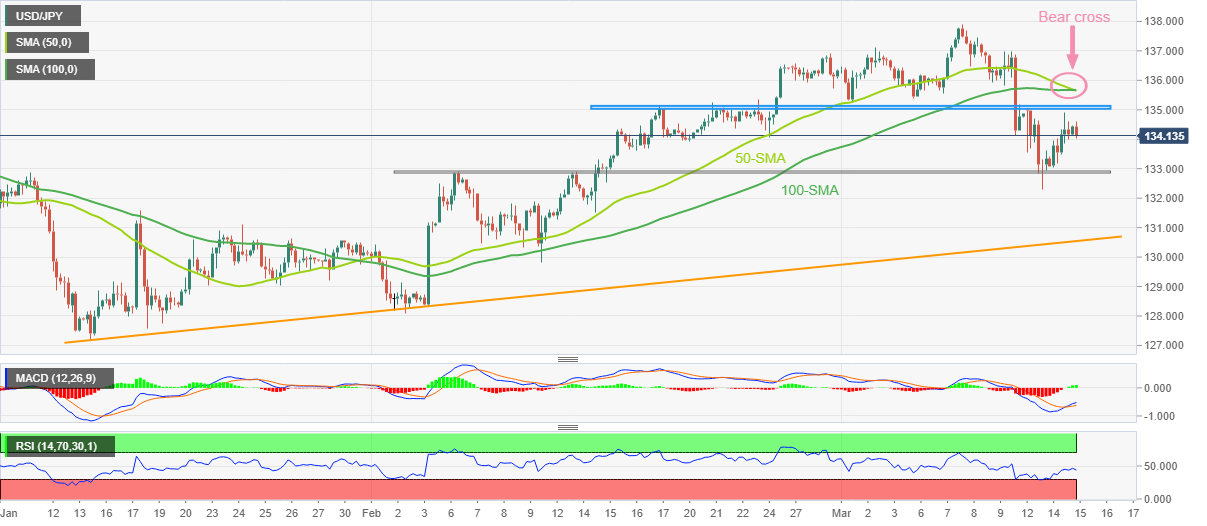
  • 50-SMA pierces off 100-SMA from above to portray bearish signal.
  • Downbeat RSI, failure to cross three-week-old horizontal resistance keep sellers hopeful.
  • Multiple tops marked since early February, two-month-long ascending support line challenge Yen pair bears.

USD/JPY takes offers to renew intraday low around 134.00 during early Wednesday as the Yen pair sellers reverse the previous day’s corrective bounce off a one-month low. In doing so, the quote justifies the bearish signals from the moving average crossover, as well as the downbeat Relative Strength Index (RSI) line, placed at 14.

That said, the 50-SMA prods the 100-SMA from above and joins the downbeat RSI line to suggest the USD/JPY pair’s further declines.

However, a five-week-old horizontal support area near 133.90-85 appears a tough nut to crack for the Yen pair bears.

In a case where the USD/JPY slips beneath the 133.85 support, the odds of witnessing an extended south-run towards a two-month-old ascending support line, close to 130.55 by the press time, can’t be ruled out.

Meanwhile, an area comprising multiple tops marked since February 17, near 135.05-15, restricts immediate USD/JPY upside.

Even if the quote traces the bullish MACD signals and crosses the 135.15 resistance, a convergence of the 50-SMA and the 100-SMA, around 135.65-70 by the press time, will be crucial to watch as it holds the key for the USD/JPY run-up towards the monthly high of 137.91.

USD/JPY: Four-hour chart

Trend: Further downside expected

Additional important levels

Overview
Today last price134.04
Today Daily Change-0.19
Today Daily Change %-0.14%
Today daily open134.23
 
Trends
Daily SMA20135.36
Daily SMA50132.52
Daily SMA100135.69
Daily SMA200137.5
 
Levels
Previous Daily High134.9
Previous Daily Low133.03
Previous Weekly High137.91
Previous Weekly Low134.12
Previous Monthly High136.92
Previous Monthly Low128.08
Daily Fibonacci 38.2%134.19
Daily Fibonacci 61.8%133.74
Daily Pivot Point S1133.2
Daily Pivot Point S2132.18
Daily Pivot Point S3131.33
Daily Pivot Point R1135.08
Daily Pivot Point R2135.93
Daily Pivot Point R3136.95

Author

Anil Panchal

Anil Panchal

FXStreet

Anil Panchal has nearly 15 years of experience in tracking financial markets. With a keen interest in macroeconomics, Anil aptly tracks global news/updates and stays well-informed about the global financial moves and their implications.

More from Anil Panchal
Share:

Markets move fast. We move first.

Orange Juice Newsletter brings you expert driven insights - not headlines. Every day on your inbox.

By subscribing you agree to our Terms and conditions.

Editor's Picks

EUR/USD moves sideways below 1.1800 on Christmas Eve

EUR/USD struggles to find direction and trades in a narrow channel below 1.1800 after posting gains for two consecutive days. Bond and stock markets in the US will open at the usual time and close early on Christmas Eve, allowing the trading action to remain subdued. 

GBP/USD keeps range around 1.3500 amid quiet markets

GBP/USD keeps its range trade intact at around 1.3500 on Wednesday. The Pound Sterling holds the upper hand over the US Dollar amid pre-Christmas light trading as traders move to the sidelines heading into the holiday season. 

Gold retreats from record highs, trades below $4,500

Gold retreats after setting a new record-high above $4,520 earlier in the day and trades in a tight range below $4,500 as trading volumes thin out ahead of the Christmas break. The US Dollar selling bias remains unabated on the back of dovish Fed expectations, which continues to act as a tailwind for the bullion amid persistent geopolitical risks.

Bitcoin slips below $87,000 as ETF outflows intensify, whale participation declines

Bitcoin price continues to trade around $86,770 on Wednesday, after failing to break above the $90,000 resistance. US-listed spot ETFs record an outflow of $188.64 million on Tuesday, marking the fourth consecutive day of withdrawals.

Economic outlook 2026-2027 in advanced countries: Solidity test

After a year marked by global economic resilience and ending on a note of optimism, 2026 looks promising and could be a year of solid economic performance. In our baseline scenario, we expect most of the supportive factors at work in 2025 to continue to play a role in 2026.

Avalanche struggles near $12 as Grayscale files updated form for ETF

Avalanche trades close to $12 by press time on Wednesday, extending the nearly 2% drop from the previous day. Grayscale filed an updated form to convert its Avalanche-focused Trust into an ETF with the US Securities and Exchange Commission.