USD/JPY Price Analysis: Is another top forming?
- The USD/JPY has climbed back to near previous peaks above 150, could this be a sign it is topping?
- Indicators remain mostly ambivalent and price action relatively muted so it’s too early to say.
- Rumors the BoJ may be about to raise interest rates have stimulated talk of a USD/JPY breakdown

The USD/JPY pair has been a broad, sweeping sideways trend since peaking in October 2022. Although higher lows have suggested an underlying bullish bias the pair has failed to surpass the 2022 highs, indicating an overall balanced market.
Rumors that the Bank of Japan (BoJ) could be preparing to raise interest rates have reignited speculative interest in the Yen and led many to hail a renaissance in the currency.
Japan’s negative interest rates have long made the Yen a popular funding currency for the carry trade. This is an operation in which investors borrow in a currency with a low interest rate, like the JPY, and use the relatively cheap loan to fund the purchase of a currency with a higher interest rate, such as the US Dollar (USD), pocketing the difference in rates as profit. Over time this has acted as a negative factor for JPY and driven the USD/JPY to new highs.
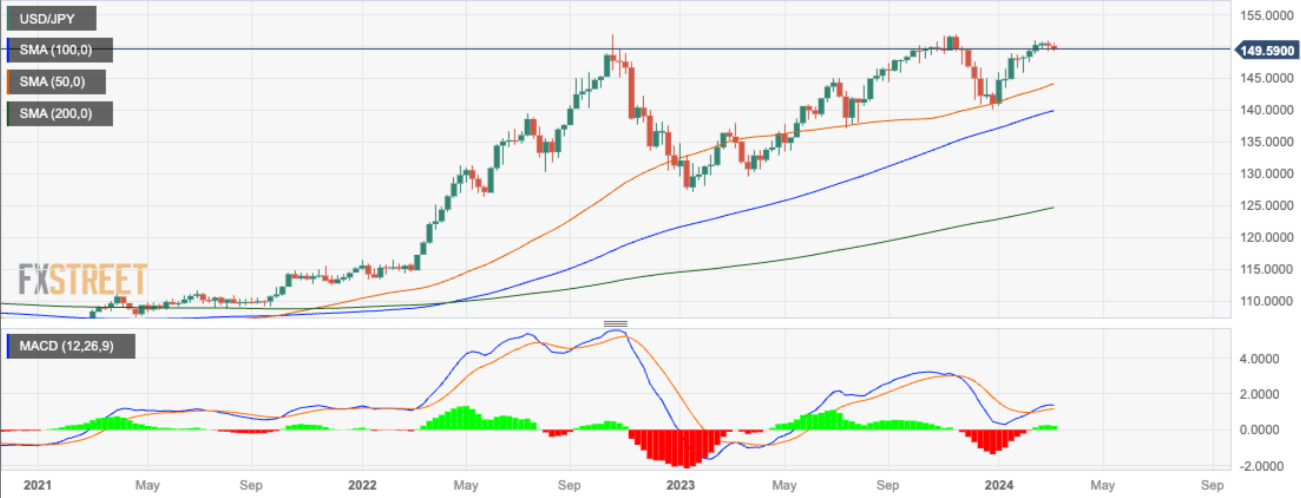
US Dollar vs Swiss Franc: Weekly chart
From a technical perspective the pair overall remains in a sideways trend, with some bearish signs appearing on the horizon.
As can be seen on the weekly chart above, after peaking at 150.84 last week, USD/JPY has entered the zone of previous major highs in the 151s – possibly a sign it is topping – however, there has so far been insufficient downside price action to definitively say it is rolling over.
The lack of upside momentum, however, is a sign the uptrend could be waning. The Moving Average Convergence/Divergence (MACD) has shown much less progress higher during the 2024 rally compared to the 2023 rally, suggesting bulls are tired. Still, without a concomitant decline in price as well, the long-term technical conclusion is neutral.
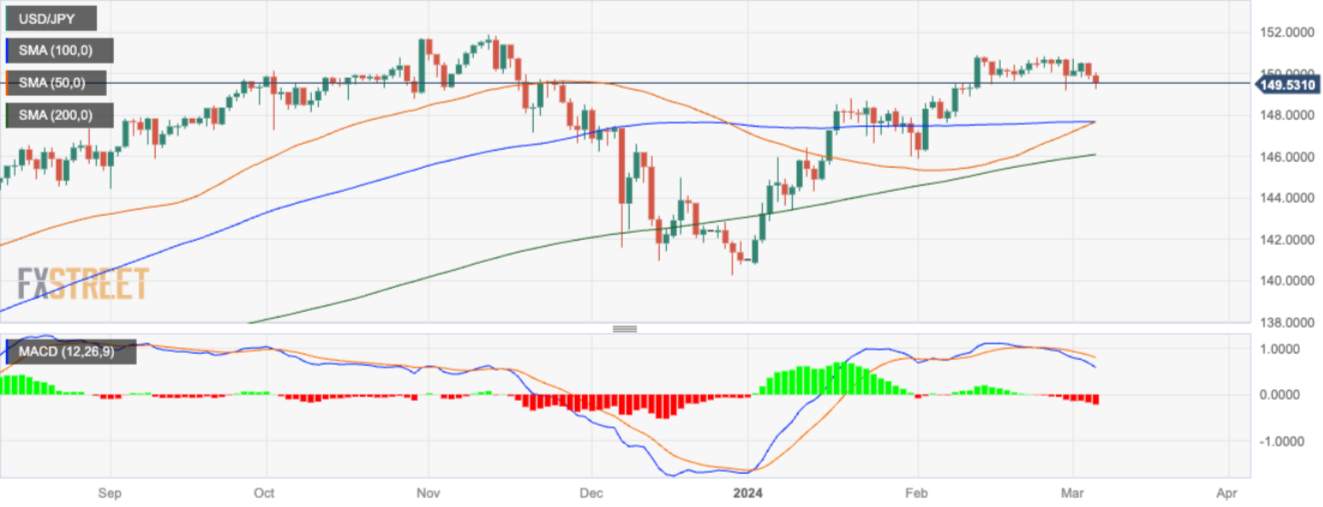
US Dollar vs Swiss Franc: Daily chart
The daily chart above shows more compelling evidence the pair could be about to move lower. The MACD has just given a sell signal after the blue MACD line crossed below the red signal line at the end of February.
The indicator has reliably signaled the turning points in the medium-term sideways trend – both after the November 2023 highs and the January 2024 lows – so it is possible it may be correctly signaling the next move down. If so, the next downside target lower would be at around 148.00 where the 100 and 50-day Simple Moving Averages (SMA) are situated.
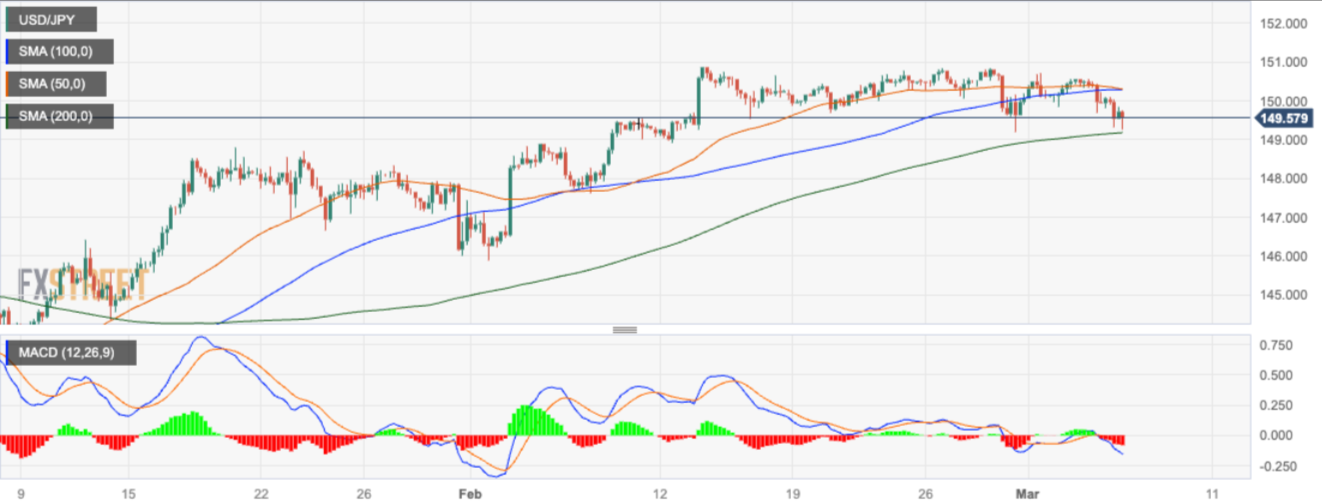
US Dollar vs Swiss Franc: 4-hour chart
The 4-hour chart, used to assess the short-term trend, is showing the formation of a long sideways range since February 12. Whilst price is currently knocking at the floor of this range and risks a downside break, it is still too early to say this is the case for sure.
The MACD is relatively low at the moment, suggesting strong downside momentum, however, it would require a break below the base of the range at 149.00, and the 200-4-hour SMA at the same level, to signal a breakdown was actually occurring. Until that happens the short-term trend remains neutral with the potential for a recovery back inside the range.
If a clear breakout lower did materialize, however, it would suggest a decline to the next target at 148.00 which is equivalent to the height of the range extrapolated lower, and also sits at the confluence of MAs on the daily chart.
Author

Joaquin Monfort
FXStreet
Joaquin Monfort is a financial writer and analyst with over 10 years experience writing about financial markets and alt data. He holds a degree in Anthropology from London University and a Diploma in Technical analysis.


