|

USD/JPY Price Analysis: Hoovers around 144.70 due to a lack of catalyst

  • USD/JPY remains subdued around the 144.40-80 area as traders brace for the weekend.
  • The interest rates differential, and central bank monetary policy divergence, are tailwinds for the USD/JPY.

The USD/JPY consolidates in the 144.00-145.00 area following last week’s Bank of Japan (BoJ) intervention, which had kept the major directionless, as traders remain on the sidelines. Despite the solid correlation with the US 10-year T-bond yield, piercing the 4% threshold during the week, the USD/JPY did not attempt to clear the 145.00 figure. At the time of writing, the USD/JPY is trading at 144.70, above its opening price.

USD/JPY Price Analysis: Technical outlook

Given the backdrop that, fundamentally speaking, the interest rates differential between both economies, the central bank divergency with the Bank of Japan’s dovish stance is a tailwind for the USD/JPY.

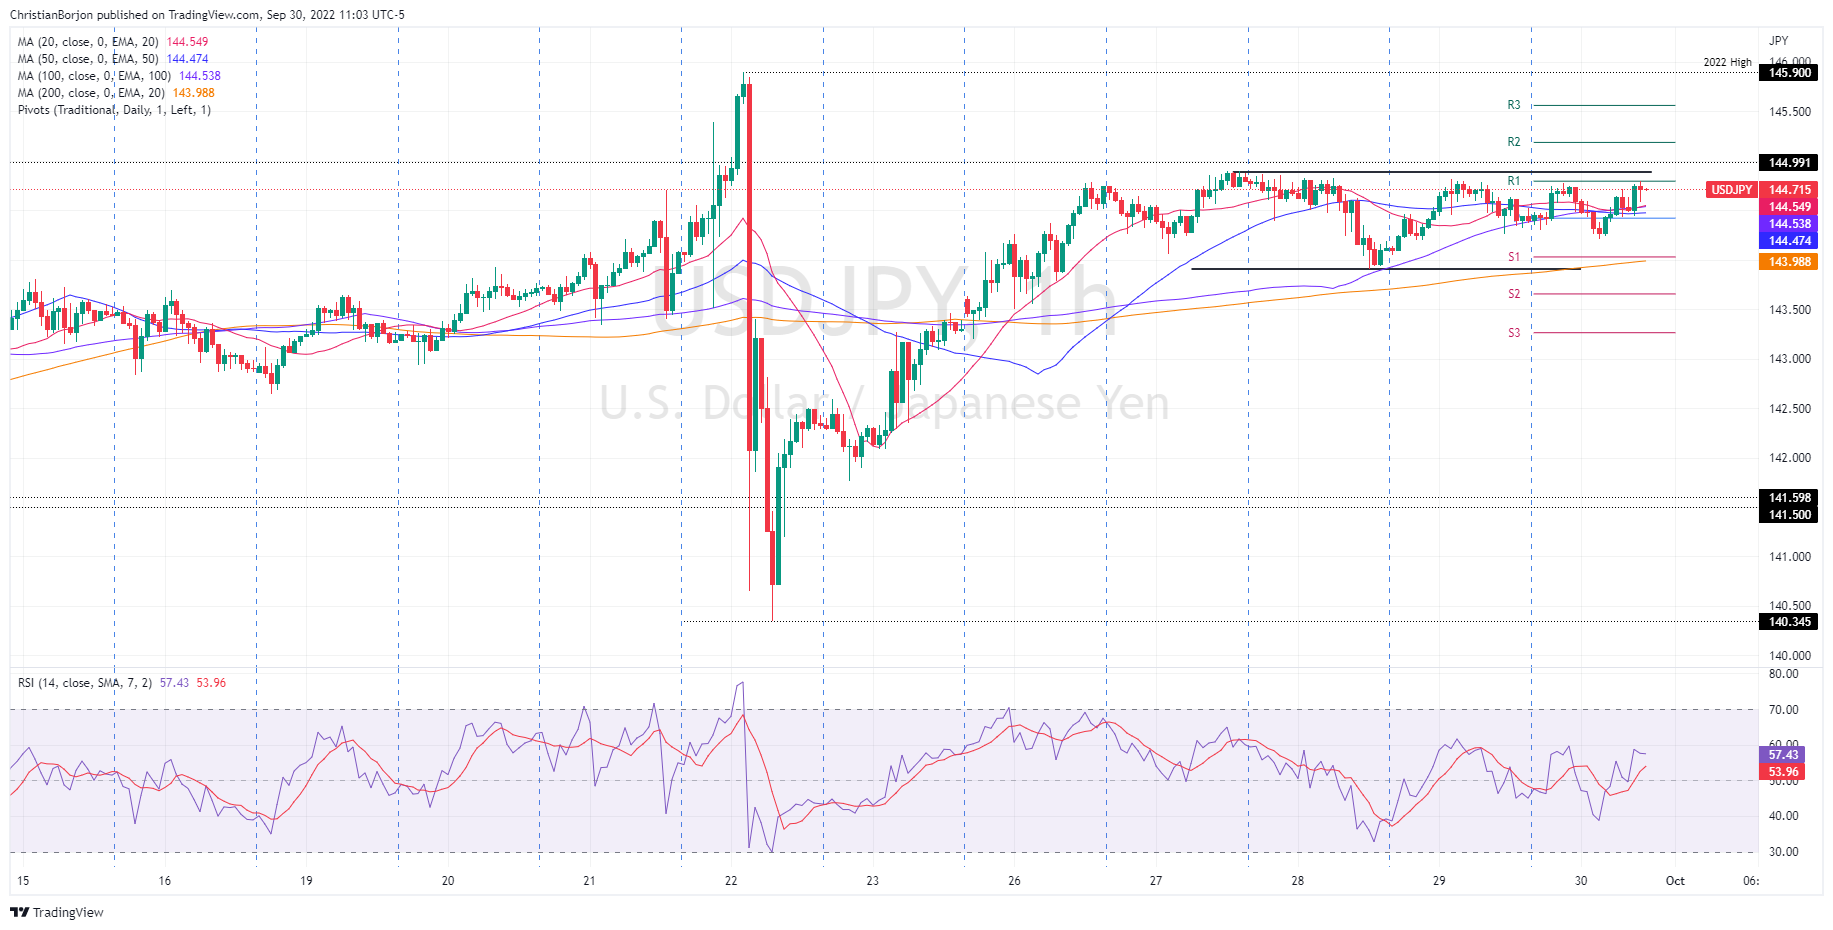
From a technical analysis perspective, the USD/JPY is range-bound, though it remains upward biased, based on where the daily moving averages (DMAs) are located. During the week, the USD/JPY trading range has been the 143.50-144.90 area, so any breaks below would likely send the major towards the 140.00 figure. Conversely, a re-test of the 145.00 is possible, but with the BoJ vigilance around it, traders are not challenging the central bank.

The USD/JPY one-hour chart depicted a triple-top formation that extended to a multi-top, with the major remaining trendless. On the downside, the confluence of the 20, 50, and 100-EMA at around 144.47/53 are support levels, which, once cleared, will send the USD/JPY towards the S1 daily pivot at 144.02, shy of the 200-EMA. A breach of the latter will expose the S2 pivot at 143.50, followed by the S3 daily pivot point at 143.27.

USD/JPY Key Technical Levels

USD/JPY

Overview
Today last price144.72
Today Daily Change0.25
Today Daily Change %0.17
Today daily open144.47
 
Trends
Daily SMA20143.29
Daily SMA50138.66
Daily SMA100136.05
Daily SMA200127.82
 
Levels
Previous Daily High144.81
Previous Daily Low144.06
Previous Weekly High145.9
Previous Weekly Low140.35
Previous Monthly High139.08
Previous Monthly Low130.4
Daily Fibonacci 38.2%144.53
Daily Fibonacci 61.8%144.35
Daily Pivot Point S1144.09
Daily Pivot Point S2143.7
Daily Pivot Point S3143.34
Daily Pivot Point R1144.83
Daily Pivot Point R2145.2
Daily Pivot Point R3145.58

Author

Christian Borjon Valencia

Christian Borjon began his career as a retail trader in 2010, mainly focused on technical analysis and strategies around it. He started as a swing trader, as he used to work in another industry unrelated to the financial markets.

More from Christian Borjon Valencia
Share:

Markets move fast. We move first.

Orange Juice Newsletter brings you expert driven insights - not headlines. Every day on your inbox.

By subscribing you agree to our Terms and conditions.

Editor's Picks

EUR/USD runs past 1.1730 after tepid US macroeconomic figures

EUR/USD extends its gains and trades above 1.1730 in the American session on Thursday. The US Dollar resumed its decline, following much weaker-than-expected Initial Jobless Claims. Market players bet for additional rate cuts despite a mildly hawkish Fed.

GBP/USD ticks north beyond 1.3400 after US employment data

GBP/USD ticks beyond 1.3400 in the American session on Thursday, as the US Dollar is back on the losing side, following worse-than-anticipated US employment-related figures. The US Federal Reserve delivered a rate cut at its December meeting, in line with the market’s expectations.

Gold on its way to retest record highs

Broad US Dollar weakness helps the bright metal to extend weekly gains. The XAU/USD pair trades above $4,250, its highest for the week and not far from its record high in the $4,380 region. The Greenback came under selling pressure on Wednesday following the Federal Reserve's monetary policy announcement, further pressured on Thursday by softer-than-anticipated United States employment data. 

Solana dips as hawkish Fed cuts dampen market sentiment

Solana price is trading below $130 on Thursday, after being rejected at the upper boundary of its falling wedge pattern. The broader market weakness following the Federal Reserve’s hawkish rate cut has added to downside momentum.

FOMC Summary: A split cut and a clear shift toward caution

The Federal Reserve (Fed) went ahead with a 25 basis points rate cut, taking the target range to 3.50–3.75%. But the tone around the decision mattered just as much as the move.

Solana dips as hawkish Fed cuts dampen market sentiment
Solana (SOL) price is trading below $130 at the time of writing on Thursday, after being rejected at the upper boundary of its falling wedge pattern. The broader market weakness following the Federal Reserve’s hawkish rate cut has added to downside momentum.