USD/JPY Price Analysis: Holds steady above 148.00, bulls have the hand near YTD peak
- USD/JPY eases from the YTD peak touched earlier this Thursday, though lacks follow-through.
- Comments by Japan’s Matsuno fuel intervention fears and prompt some selling around the pair.
- The Fed's hawkish outlook continues to underpin the USD and helps limit losses for the major.
- The technical setup remains tilted in favour of bulls and supports prospects for a further move up.

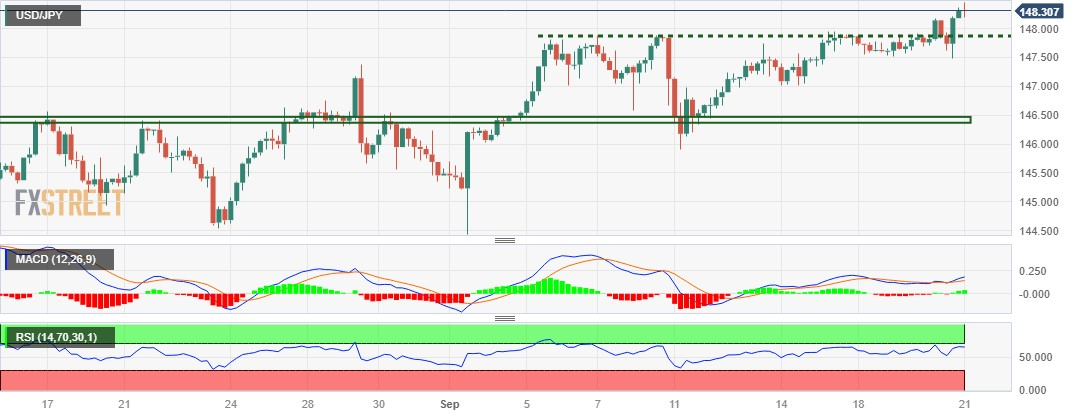
The USD/JPY pair pulls back after hitting a fresh YTD peak, around the 148.45 region during the Asian session this Thursday, albeit lacks follow-through and manages to hold above the daily trough. Spot prices currently trade around the 148.25 area, down less than 0.10% for the day, and seem poised to appreciate further.
Against the backdrop of the recent breakout through the 146.50-146.60 strong horizontal barrier, the overnight sustained strength and a daily close above the 148.00 mark could be seen as a fresh trigger for bullish traders. The positive outlook for the USD/JPY pair is reinforced by the underlying bullish sentiment surrounding the US Dollar (USD), bolstered by the Federal Reserve's (Fed) hawkish outlook.
That said, comments by Japan’s Chief Cabinet Secretary Hirokazu Matsuno, saying that he won't rule out any options for response to FX moves, raises the risk of an intervention by authorities to prop up the domestic currency. Apart from this, speculations that the Bank of Japan (BoJ) could move away from the negative interest rates policy benefit the Japanese Yen (JPY) and cap the upside for the USD/JPY pair.
Technical indicators on the daily chart, meanwhile, are holding comfortably in the positive territory and are still far from being in the overbought zone. This, in turn, favours bullish traders and suggests that the path of least resistance for the USD/JPY pair is to the upside. Hence, any meaningful corrective decline below the 148.00 round figure might still be seen as a buying opportunity near the 147.70-147.65 area
The latter is closely followed by the weekly trough, around mid-147.00s, which if broken decisively might prompt some technical selling and drag the USD/JPY pair back towards the 147.00 round figure. Spot prices could then slide to the 146.50 horizontal support before eventually dropping to last week's swing low or sub-146.00 levels.
On the flip side, bulls might now wait for some follow-through strength beyond the 148.45 region, or the daily peak, before placing fresh bets. The subsequent move up has the potential to lift the USD/JPY pair towards the next relevant hurdle near the 148.80-148.85 region en route to the 149.00 round figure. The momentum could get extended further to the 149.70 area, above which spot prices could aim to reclaim the 150.00 psychological mark for the first time since October 2022.
USD/JPY 4-hour chart
Technical levels to watch
Author

Haresh Menghani
FXStreet
Haresh Menghani is a detail-oriented professional with 10+ years of extensive experience in analysing the global financial markets.


