|

USD/JPY Price Analysis: Hangs near daily low, just below 133.00 amid modest USD weakness

  • USD/JPY retreats from over a two-week high touched earlier this Monday.
  • The emergence of fresh selling around the USD exerts downward pressure.
  • The 100-day SMA and 50% Fibo. confluence hurdle holds the key for bulls.

The USD/JPY pair attracts some sellers after touching over a two-week high on Monday and trades just below the 133.00 round-figure mark during the early North American session.

The US Dollar (USD) struggles to capitalize on its intraday gains amid the uncertainty over the Fed's rate-hike path, which turns out to be a key factor exerting some downward pressure on the USD/JPY pair. The downside, however, seems limited, at least for the time being, amid a generally positive risk tone, which tends to undermine the traditional safe-haven Japanese Yen (JPY).

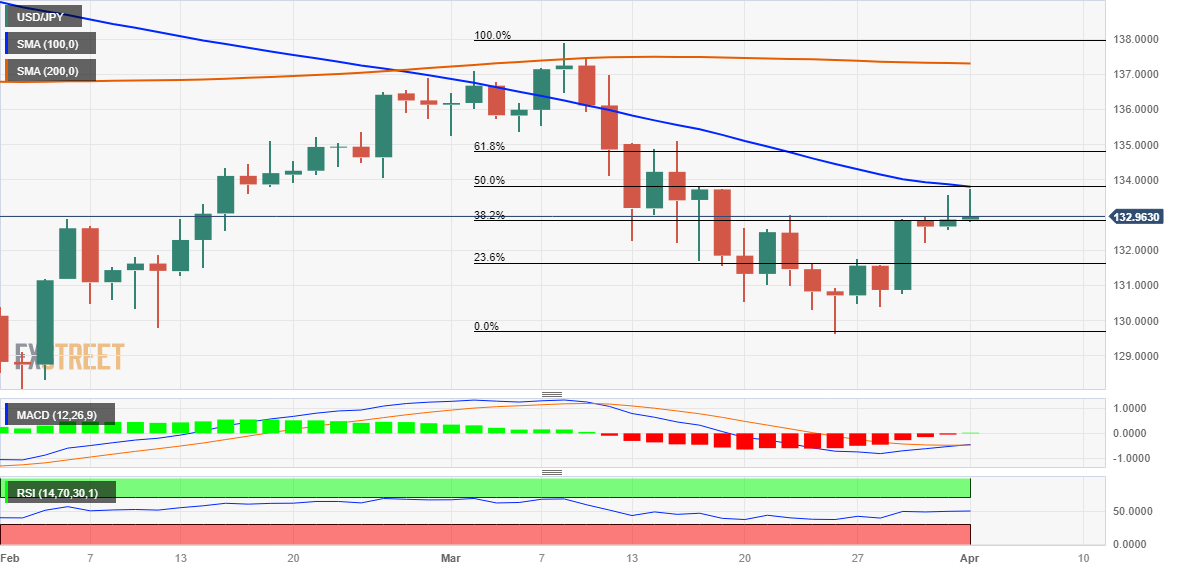
From a technical perspective, the USD/JPY pair faces rejection near the 133.75 confluence hurdle, comprising the 50% Fibonacci retracement level of the March downfall and the 100-day Simple Moving Average (SMA). The said area should now act as a pivotal point, which if cleared will set the stage for an extension of the recent move-up witnessed over the past week or so.

That said, oscillators on the daily chart are yet to confirm a bullish outlook, making it prudent to wait for a move beyond the aforementioned barrier before positioning for any further gains. The USD/JPY pair might then aim to surpass the 134.00 round-figure mark and accelerate the momentum towards testing the 61.8% Fibo. level resistance, around the 134.75-134.80 region.

On the flip side, any further slide below the 132.80 area, or the 38.2% Fibo. level, is likely to find decent support near the 132.25 region ahead of the 132.00 mark and the 23.6% Fibo. level, around the 131.60-131.55 zone. A convincing break below the latter could drag the USD/JPY pair below the 131.00 mark, towards the next relevant support near the 130.55-130.50 region.

USD/JPY daily chart

fxsoriginal

Key levels to watch

USD/JPY

Overview
Today last price132.97
Today Daily Change0.10
Today Daily Change %0.08
Today daily open132.87
 
Trends
Daily SMA20133.27
Daily SMA50132.95
Daily SMA100133.87
Daily SMA200137.32
 
Levels
Previous Daily High133.6
Previous Daily Low132.59
Previous Weekly High133.6
Previous Weekly Low130.41
Previous Monthly High137.91
Previous Monthly Low129.64
Daily Fibonacci 38.2%133.21
Daily Fibonacci 61.8%132.97
Daily Pivot Point S1132.44
Daily Pivot Point S2132.01
Daily Pivot Point S3131.43
Daily Pivot Point R1133.45
Daily Pivot Point R2134.03
Daily Pivot Point R3134.46

Author

Haresh Menghani

Haresh Menghani is a detail-oriented professional with 10+ years of extensive experience in analysing the global financial markets.

More from Haresh Menghani
Share:

Markets move fast. We move first.

Orange Juice Newsletter brings you expert driven insights - not headlines. Every day on your inbox.

By subscribing you agree to our Terms and conditions.

Editor's Picks

EUR/USD moves sideways below 1.1800 on Christmas Eve

EUR/USD struggles to find direction and trades in a narrow channel below 1.1800 after posting gains for two consecutive days. Bond and stock markets in the US will open at the usual time and close early on Christmas Eve, allowing the trading action to remain subdued. 

GBP/USD keeps range around 1.3500 amid quiet markets

GBP/USD keeps its range trade intact at around 1.3500 on Wednesday. The Pound Sterling holds the upper hand over the US Dollar amid pre-Christmas light trading as traders move to the sidelines heading into the holiday season. 

Gold retreats from record highs, trades below $4,500

Gold retreats after setting a new record-high above $4,520 earlier in the day and trades in a tight range below $4,500 as trading volumes thin out ahead of the Christmas break. The US Dollar selling bias remains unabated on the back of dovish Fed expectations, which continues to act as a tailwind for the bullion amid persistent geopolitical risks.

Bitcoin slips below $87,000 as ETF outflows intensify, whale participation declines

Bitcoin price continues to trade around $86,770 on Wednesday, after failing to break above the $90,000 resistance. US-listed spot ETFs record an outflow of $188.64 million on Tuesday, marking the fourth consecutive day of withdrawals.

Economic outlook 2026-2027 in advanced countries: Solidity test

After a year marked by global economic resilience and ending on a note of optimism, 2026 looks promising and could be a year of solid economic performance. In our baseline scenario, we expect most of the supportive factors at work in 2025 to continue to play a role in 2026.

Avalanche struggles near $12 as Grayscale files updated form for ETF

Avalanche trades close to $12 by press time on Wednesday, extending the nearly 2% drop from the previous day. Grayscale filed an updated form to convert its Avalanche-focused Trust into an ETF with the US Securities and Exchange Commission.