|

USD/JPY Price Analysis: Greenback down sharply, nearing 106.00 figure vs. Japanese yen

  • USD/JPY trades down despite broad-based USD strength. 
  • The level to beat for bears is the 105.70 support.
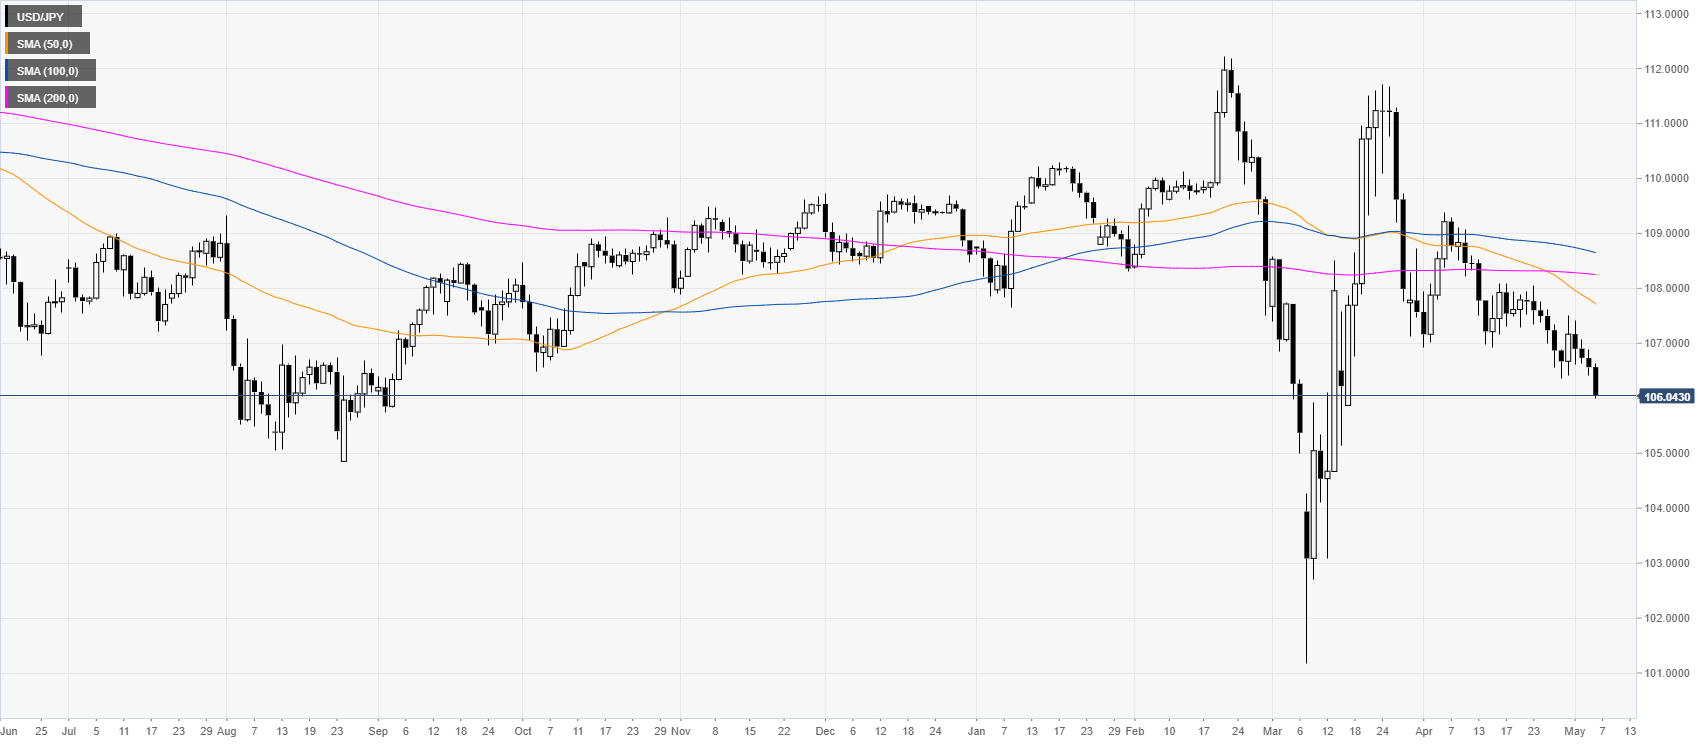
 

USD/JPY daily chart

 
USD/JPY gets another bearish day despite broad-based USD strength this Wednesday. The spot is trading below the main SMAs on the daily chart suggesting a bearish bias. Moreover, the 50 SMA crossed below the 200 SMA creating a death cross which can result in more downward traction for the currency pair.
  

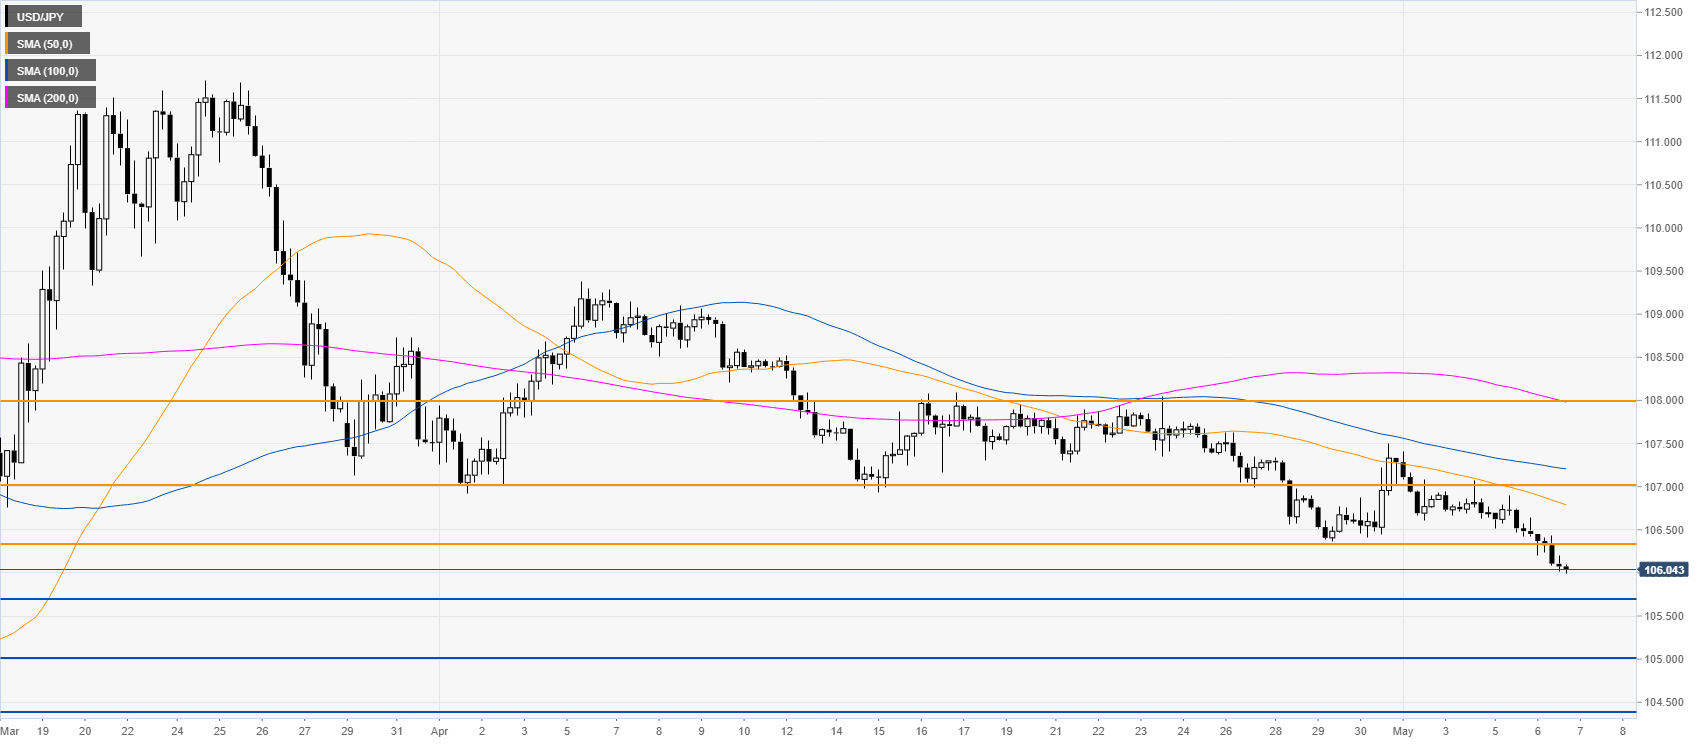
USD/JPY four-hour chart

 
USD/JPY is drifting down below its main SMAs on the four-hour chart as the spot is nearing the 106.00 figure. The market broke below the April lows and it seems that the bears are now in full control. A break below the 105.70 support can see more downside price movements. On the flip side, resistance is expected to hold near 106.30 and 107.00 resistances. 
 

Additional key levels

USD/JPY

Overview
Today last price106.03
Today Daily Change-0.54
Today Daily Change %-0.51
Today daily open106.57
 
Trends
Daily SMA20107.5
Daily SMA50107.79
Daily SMA100108.68
Daily SMA200108.27
 
Levels
Previous Daily High106.9
Previous Daily Low106.42
Previous Weekly High107.62
Previous Weekly Low106.36
Previous Monthly High109.38
Previous Monthly Low106.36
Daily Fibonacci 38.2%106.6
Daily Fibonacci 61.8%106.71
Daily Pivot Point S1106.36
Daily Pivot Point S2106.15
Daily Pivot Point S3105.88
Daily Pivot Point R1106.84
Daily Pivot Point R2107.1
Daily Pivot Point R3107.31

Author

Flavio Tosti

Flavio Tosti

Independent Analyst


More from Flavio Tosti
Share:

Editor's Picks

EUR/USD edges lower below 1.1650 as Middle East tensions fuel US Dollar strength

The EUR/USD pair trades in negative territory around 1.1635 during the early Asian session on Thursday. The US Dollar strengthens against the Euro as escalating Middle East conflict boosts safe-haven flows. Traders brace for the Eurozone Retail Sales and US weekly Initial Jobless Claims reports, which will be released later on Thursday. 

GBP/USD tests key moving averages as growth downgrade weighs

GBP/USD was nearly flat on Wednesday, edging up 0.08% to settle around 1.3370 in a quiet session. The pair has fallen sharply from its late-January high near 1.3870 and is now testing the 200-day Exponential Moving Average, with this week's one-week forex heatmap showing Pound Sterling as one of the worst performers against the US Dollar, down about 1.4% on the week.

Gold buyers stay hopeful amid Middle East war, China growth woes

Gold is building on the previous rebound in Thursday’s Asian trades, testing offers once again at the $5,200 threshold. Deeper escalation of the Middle East war and dovish US Federal Reserve monetary policy outlook continue to support Gold.

Trump presses Congress on CLARITY bill after meeting with Coinbase CEO

US President Donald Trump is urging legislators to pass the CLARITY Act after allegedly meeting with Coinbase CEO Brian Armstrong amid growing dispute over stablecoin yields.

First Venezuela, now Iran: The US-China energy war escalates

At first glance, the latest escalation involving the United States with both Iran and Venezuela looks like another chapter in a long-running geopolitical story. But viewed through a broader strategic lens, something else may be unfolding: Energy.

Bittensor extends recovery despite retail demand slump

Bittensor, a leading Artificial Intelligence token, is aging up above $190 at the time of writing on Wednesday. Steady price increases characterise the broader crypto market, with Bitcoin holding above $71,000 and Ethereum above $2,000.