USD/JPY Price Analysis: Further downside hinges on 131.30 break


  • USD/JPY remains pressured for third consecutive day as sellers poke one-week-old support line.
  • Bearish MACD signals, downbeat RSI signal further south-run.
  • Any recovery remains elusive below 135.00 resistance confluence.

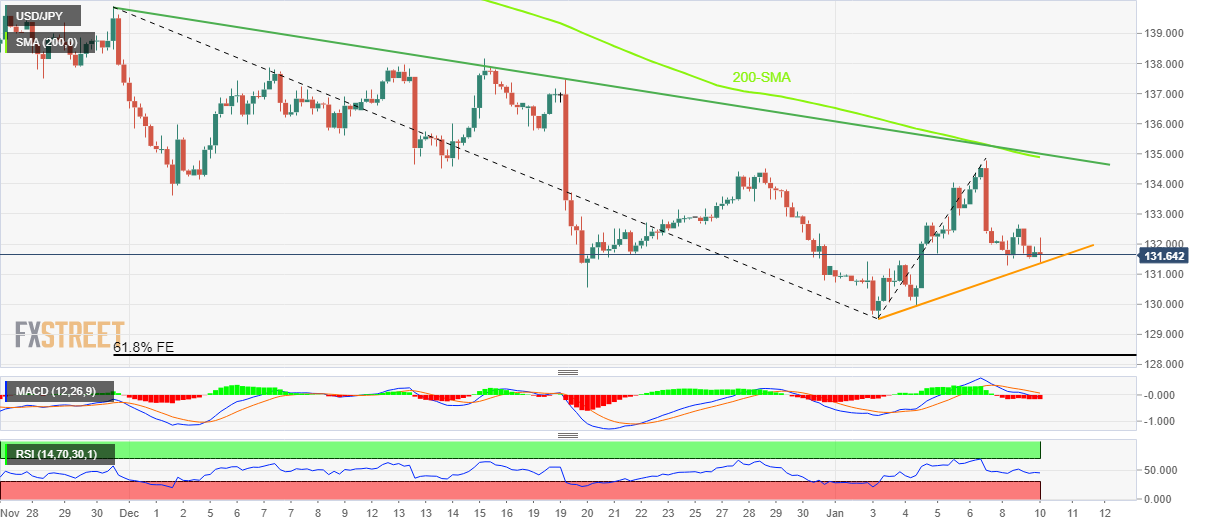
USD/JPY holds lower ground near the intraday bottom surrounding 131.30 as bears flirt with the short-term key support during early Tuesday. In doing so, the Yen pair prints a three-day downtrend while justifying the bearish MACD signals and the absence of an oversold RSI (14).

With this, the USD/JPY price is likely to remain weak and could break the one-week-old support line, near 131.30 by the press time, in the near term.

Following that, the 131.00 round figure and 130.00 psychological magnet may entertain the Yen pair sellers before directing them to the recent trough surrounding 129.50.

It’s worth noting that the RSI (14) could turn oversold when the USD/JPY hit 129.50, which in turn may trigger a corrective bounce, if not then the 61.8% Fibonacci Expansion (FE) of the pair’s moves between November 30, 2022, and January 03, 2023, close to 128.30, will be in focus.

On the contrary, recovery moves may initially aim for the previous day’s peak of 132.65 before heading towards the late December 2022 swing high surrounding 134.50.

However, the 200-SMA and a downward-sloping resistance line from November 30, 2022, close to 135.00 by the press time, will be a tough nut to crack for the USD/JPY bulls to retake control.

USD/JPY: Four-hour chart

Trend: Further downside expected

Additional important levels

Overview
Today last price 131.52
Today Daily Change -0.28
Today Daily Change % -0.21%
Today daily open 131.8
 
Trends
Daily SMA20 133.42
Daily SMA50 137.68
Daily SMA100 140.89
Daily SMA200 136.51
 
Levels
Previous Daily High 132.66
Previous Daily Low 131.3
Previous Weekly High 134.78
Previous Weekly Low 129.51
Previous Monthly High 138.18
Previous Monthly Low 130.57
Daily Fibonacci 38.2% 131.82
Daily Fibonacci 61.8% 132.14
Daily Pivot Point S1 131.18
Daily Pivot Point S2 130.57
Daily Pivot Point S3 129.83
Daily Pivot Point R1 132.53
Daily Pivot Point R2 133.27
Daily Pivot Point R3 133.88


Share: Feed news

Information on these pages contains forward-looking statements that involve risks and uncertainties. Markets and instruments profiled on this page are for informational purposes only and should not in any way come across as a recommendation to buy or sell in these assets. You should do your own thorough research before making any investment decisions. FXStreet does not in any way guarantee that this information is free from mistakes, errors, or material misstatements. It also does not guarantee that this information is of a timely nature. Investing in Open Markets involves a great deal of risk, including the loss of all or a portion of your investment, as well as emotional distress. All risks, losses and costs associated with investing, including total loss of principal, are your responsibility. The views and opinions expressed in this article are those of the authors and do not necessarily reflect the official policy or position of FXStreet nor its advertisers. The author will not be held responsible for information that is found at the end of links posted on this page.

If not otherwise explicitly mentioned in the body of the article, at the time of writing, the author has no position in any stock mentioned in this article and no business relationship with any company mentioned. The author has not received compensation for writing this article, other than from FXStreet.

FXStreet and the author do not provide personalized recommendations. The author makes no representations as to the accuracy, completeness, or suitability of this information. FXStreet and the author will not be liable for any errors, omissions or any losses, injuries or damages arising from this information and its display or use. Errors and omissions excepted.

The author and FXStreet are not registered investment advisors and nothing in this article is intended to be investment advice.

Recommended content


Recommended content

Editors’ Picks

EUR/USD clings to daily gains above 1.0650

EUR/USD clings to daily gains above 1.0650

EUR/USD gained traction and turned positive on the day above 1.0650. The improvement seen in risk mood following the earlier flight to safety weighs on the US Dollar ahead of the weekend and helps the pair push higher.

EUR/USD News

GBP/USD recovers toward 1.2450 after UK Retail Sales data

GBP/USD recovers toward 1.2450 after UK Retail Sales data

GBP/USD reversed its direction and advanced to the 1.2450 area after touching a fresh multi-month low below 1.2400 in the Asian session. The positive shift seen in risk mood on easing fears over a deepening Iran-Israel conflict supports the pair.

GBP/USD News

Gold holds steady at around $2,380 following earlier spike

Gold holds steady at around $2,380 following earlier spike

Gold stabilized near $2,380 after spiking above $2,400 with the immediate reaction to reports of Israel striking Iran. Meanwhile, the pullback seen in the US Treasury bond yields helps XAU/USD hold its ground.

Gold News

Bitcoin Weekly Forecast: BTC post-halving rally could be partially priced in Premium

Bitcoin Weekly Forecast: BTC post-halving rally could be partially priced in

Bitcoin price shows no signs of directional bias while it holds above  $60,000. The fourth BTC halving is partially priced in, according to Deutsche Bank’s research. 

Read more

Week ahead – US GDP and BoJ decision on top of next week’s agenda

Week ahead – US GDP and BoJ decision on top of next week’s agenda

US GDP, core PCE and PMIs the next tests for the Dollar. Investors await BoJ for guidance about next rate hike. EU and UK PMIs, as well as Australian CPIs also on tap.

Read more

Forex MAJORS

Cryptocurrencies

Signatures