|

USD/JPY Price Analysis: Finds some support near 23.6% Fibo., rebounds to 144.00 mark

  • USD/JPY plummets to over a one-week low on Thursday, albeit lacks follow-through selling.
  • The sharp intraday slide stalls near the 23.6% Fibo level., warranting some caution for bears.
  • A sustained strength beyond 145.00 is needed to support prospects for any further move-up.

The USD/JPY pair comes under intense selling pressure on Thursday and dives to a one-and-half-week low during the early part of the European session. Spot prices, however, manage to rebound a few pips in the last hour and currently trade around the 144.00 round-figure mark, still down nearly 0.50% for the day.

Fears of a possible intervention by Japanese authorities to prop up the domestic currency, along with the risk-off impulse, provide a goodish lift to the safe-haven Japanese Yen (JYP) and prompt aggressive selling around the USD/JPY pair. Apart from this, a modest US Dollar (USD) pullback from the weekly top further contributes to the offered tone.

That said, a big divergence in the monetary policy stance adopted by the Bank of Japan (BoJ) and other major central banks, including the Federal Reserve (Fed), caps any further gains for the JPY. Apart from this, a further rise in the US Treasury bond yields acts as a tailwind for the Greenback and limits losses for the USD/JPY pair, at least for now.

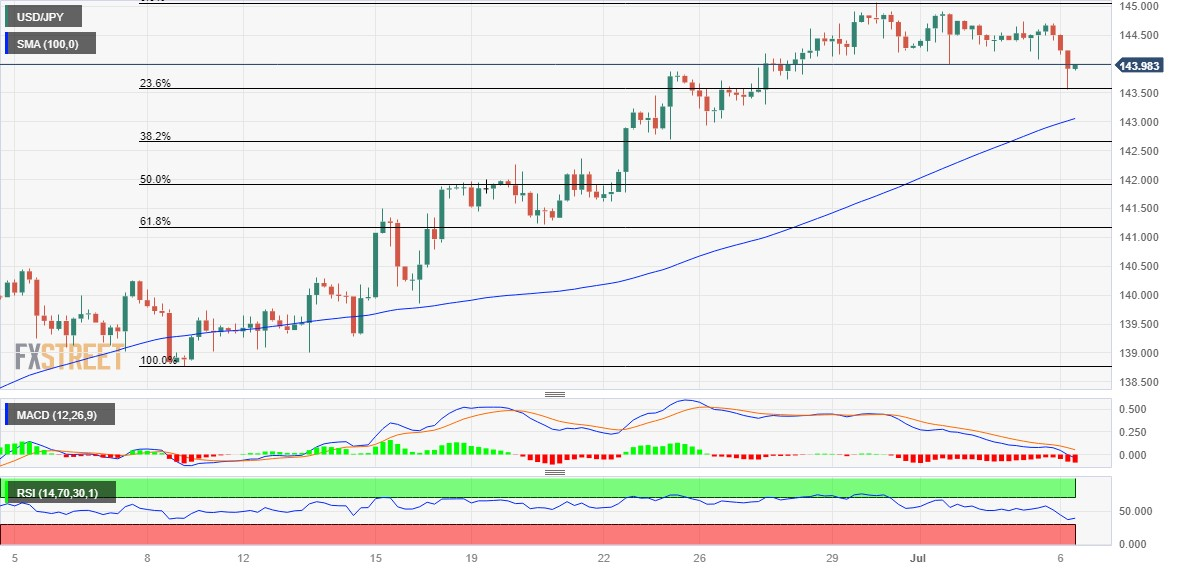
From a technical perspective, the sharp intraday slide finds support near the 143.60 region, or the 23.6% Fibonacci retracement level of the June rally, which should now act as a pivotal point. Some follow-through selling will validate a breakdown through a short-term trading range held over the past week or so and pave the way for further losses.

The USD/JPY pair might then accelerate the corrective decline towards testing the 100-period Simple Moving Average (SMA), currently pegged around the 143.00 round figure. This is closely followed by the 142.70-142.65 support or the 38.2% Fibo. level, which if broken decisively will suggest that spot prices have topped out near the 145.00 mark.

On the flip side, any recovery back above the trading range support breakpoint, around the 144.15-144.20 area, is likely to confront some resistance near the 144.70-144.75 supply zone. This is followed by the critical 145.00 psychological mark, above which the USD/JPY pair might aim to surpass the 145.35-145.40 barrier and reclaim the 146.00 round figure.

USD/JPY 4-hour chart

fxsoriginal

Key levels to watch

USD/JPY

Overview
Today last price143.91
Today Daily Change-0.75
Today Daily Change %-0.52
Today daily open144.66
 
Trends
Daily SMA20142.37
Daily SMA50139.44
Daily SMA100136.62
Daily SMA200137.24
 
Levels
Previous Daily High144.74
Previous Daily Low144.08
Previous Weekly High145.07
Previous Weekly Low142.94
Previous Monthly High145.07
Previous Monthly Low138.43
Daily Fibonacci 38.2%144.49
Daily Fibonacci 61.8%144.33
Daily Pivot Point S1144.25
Daily Pivot Point S2143.84
Daily Pivot Point S3143.59
Daily Pivot Point R1144.9
Daily Pivot Point R2145.15
Daily Pivot Point R3145.56

Author

Haresh Menghani

Haresh Menghani is a detail-oriented professional with 10+ years of extensive experience in analysing the global financial markets.

More from Haresh Menghani
Share:

Editor's Picks

GBP/USD bounces off lows, back above 1.3200

After bottoming out near 1.3160, GBP/USD manages to regain a bit of shine and reclaim the 1.3200 mark and beyond at the end of the week. Stronger-than-expected UK Retail Sales data seem to be helping the British Pound limit its losses, while the chaotic UK political environment keeps the bulls at bay for now.

EUR/USD looks consolidative around 1.1460

EUR/USD stages a modest rebound after slipping to a three-month low below 1.1420 at the end of the week. That said, the pair now looks to consolidate humble gains just above 1.1460 despite growing uncertainty surrounding the next round of US-Iran negotiations, which keeps the US Dollar’s downside contained.

Gold slips back to six-day lows, targets $4,100

Gold retreats for the third consecutive day on Friday, eroding gains seen in the first half of the week and approaching the key $4,100 mark per troy ounce. Indeed, the precious metal continues to face headwinds from the Fed's hawkish stance and renewed uncertainty surrounding the next round of US-Iran negotiations.

Solana extends correction despite ETF inflows, RWA adoption

Solana (SOL) price edges below $70 extending its losses for the fourth straight day this week. The institutional demand for Solana is building, with steady inflows so far this week and Morgan Stanley’s amended S-1 filing for a Solana-focused Exchange-Traded Fund.

The Iran war didn't break the US economy, but what happens next?

Nearly four months after the start of the Iran war, the US economy remains remarkably resilient. While the conflict initially triggered a severe disruption to global energy markets and a sharp rise in Oil prices, recent diplomatic progress between Washington and Tehran has eased concerns about a prolonged supply shock.

Regime change: Inside Kevin Warsh's first move to make the Fed unreadable on purpose

The rate did not move. That was the least interesting thing about Kevin Warsh's first meeting in charge of the Fed. The FOMC held its benchmark at 3.50%-3.75% for the fourth straight meeting, exactly as priced, and then the new chair used his first press conference to dismantle the machinery the market has leaned on for a decade.