USD/JPY Price Analysis: Enters oversold territory
- USD/JPY enters oversold territory suggesting the chance of a pullback.
- The pair has fallen rapidly over recent weeks due to expectations the BoJ will raise interest rates,
- The pair is now probably in a short-term downtrend, favoring bears.

USD/JPY is trending lower since peaking in mid February. It has fallen about $4.00 since Valentine’s Day and is currently trading in the upper 146.00s.
Expectations that the Bank of Japan (BoJ) will raise its base interest rates from negative levels are fueling a rally in the Yen. The country could even be exiting the moribund growth trend of the last 30 years, analysts at Rabobank hypothesize.
Combined with a weaker US Dollar, which has been falling on the expectation the Federal Reserve (Fed) is moving closer to cutting interest rates – made more certain by a string of dismal employment data – has led USD/JPY’s charge down.
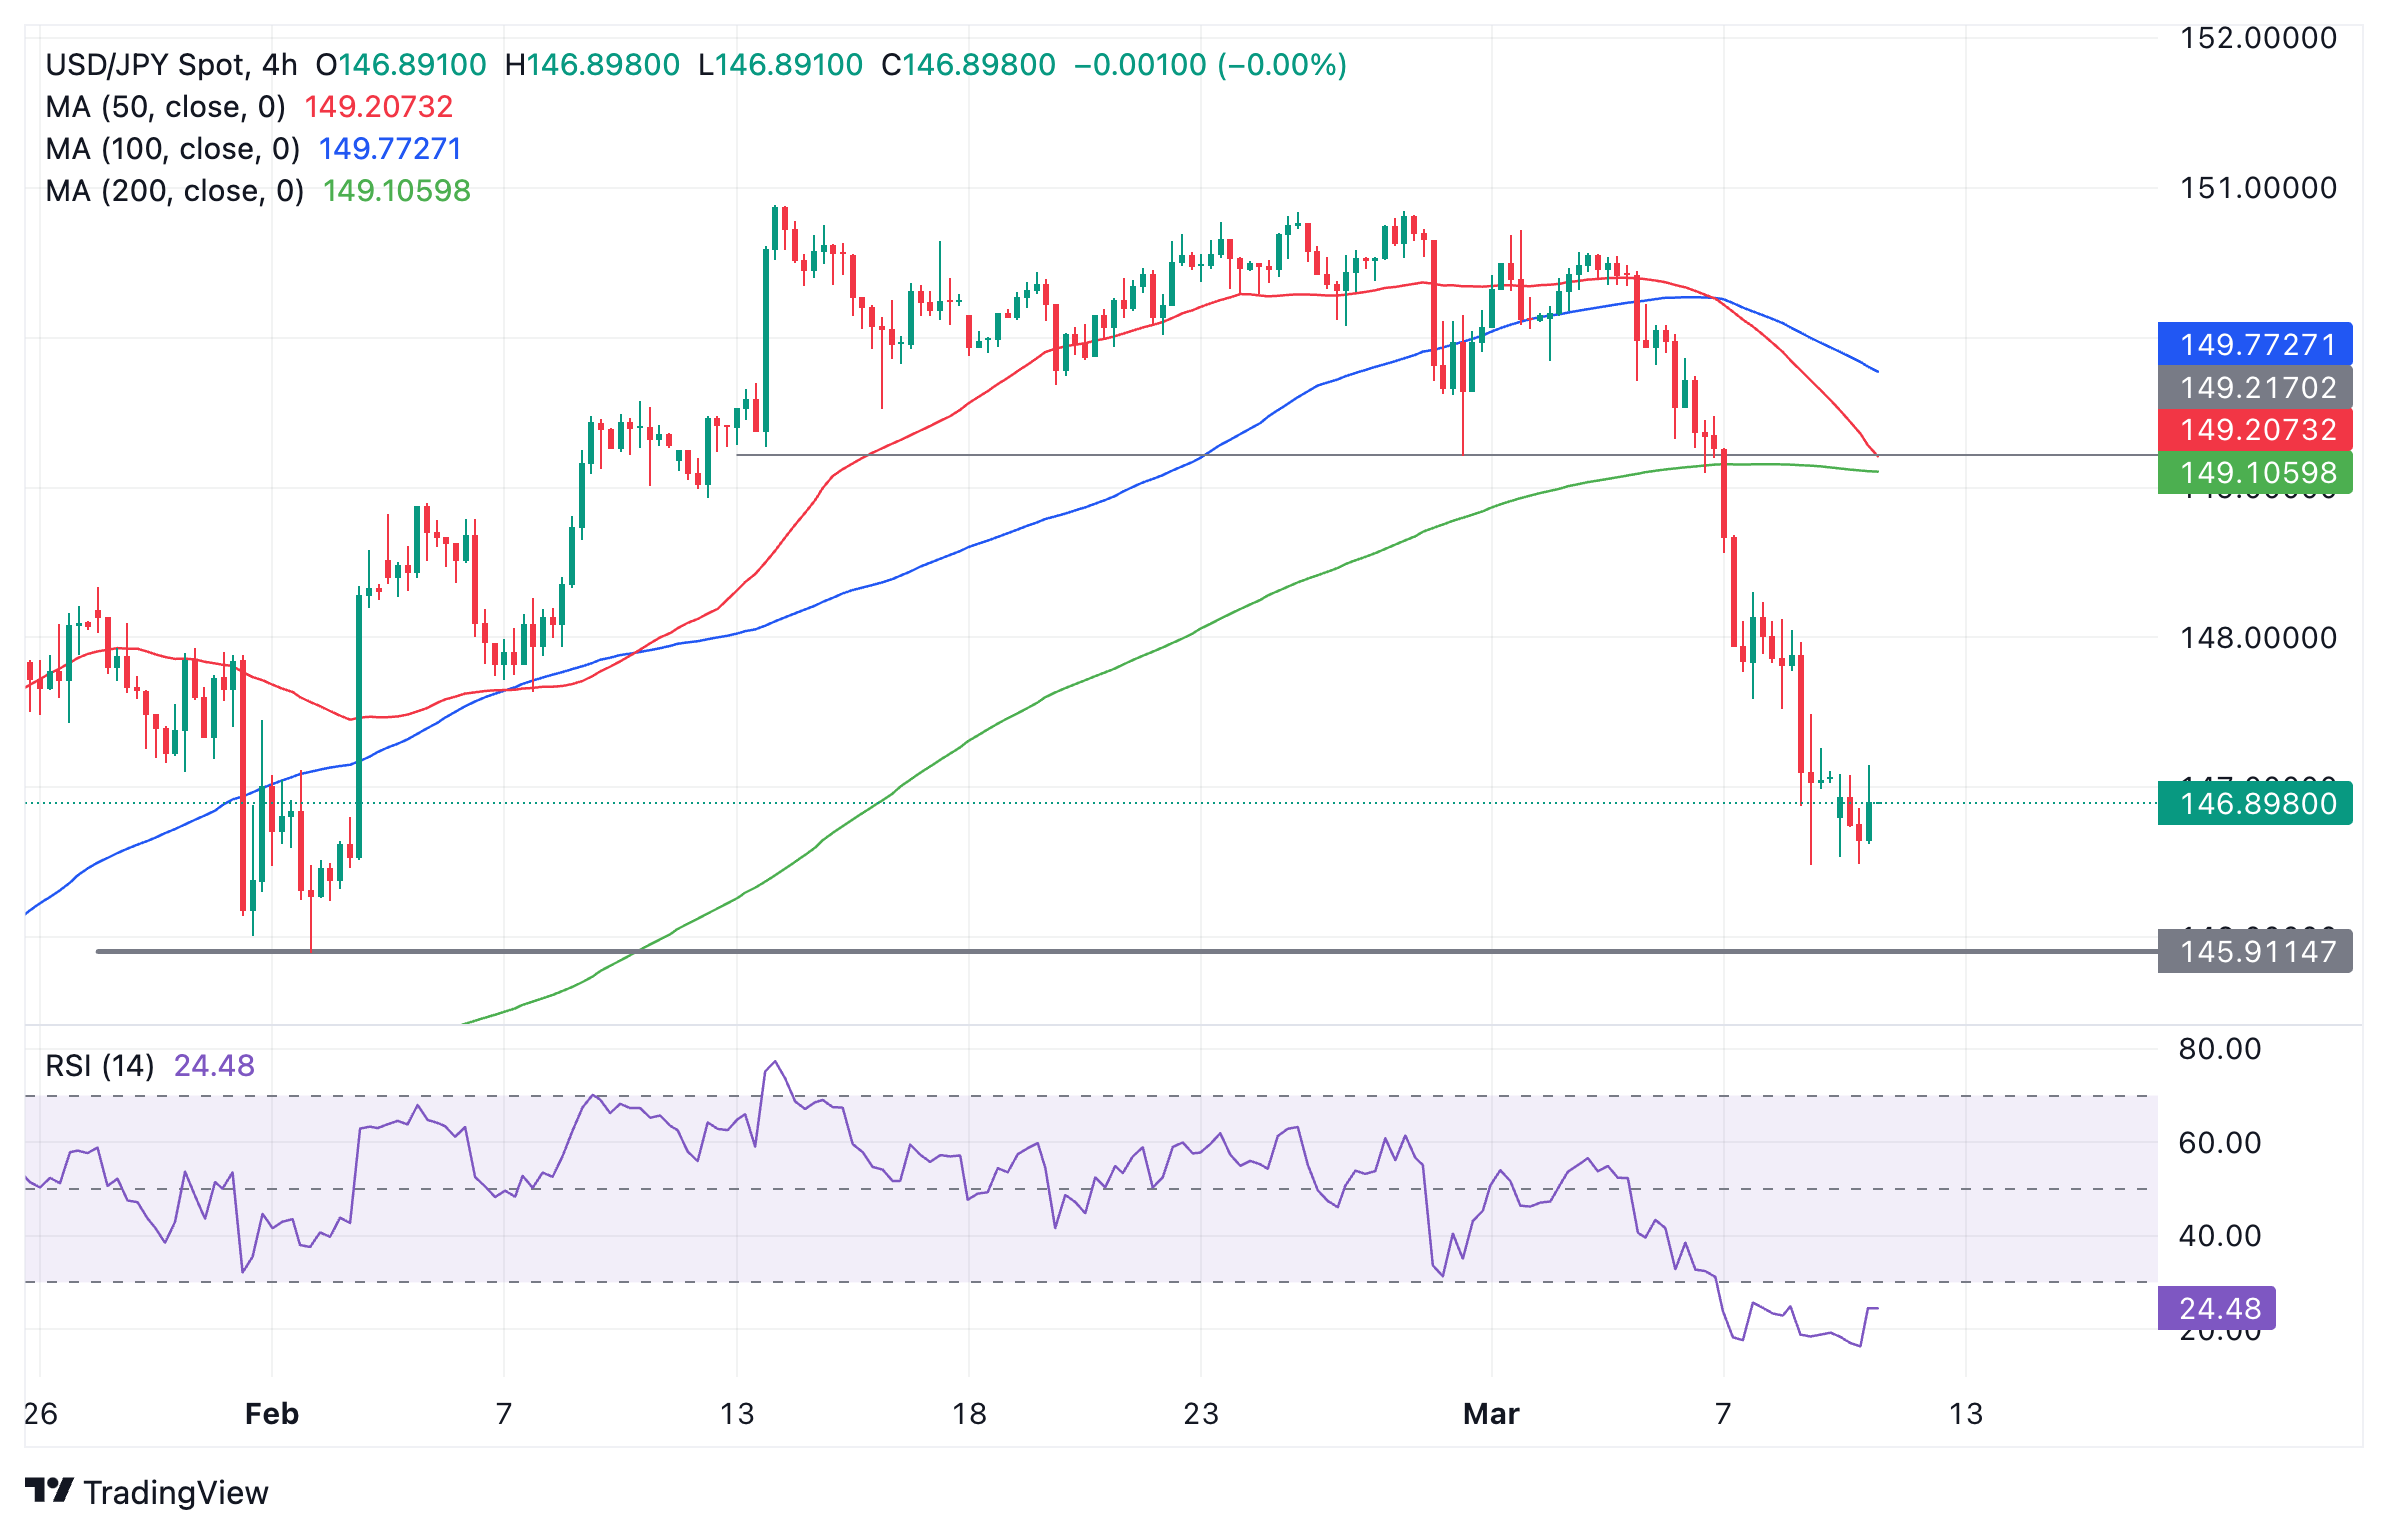
US Dollar vs Japanese Yen: 4-hour chart
The pair has fallen so swiftly and deeply that it is now probably in a short-term downtrend, which overall favors bearish bets.
There are some caveats, however, to the bearish outlook.
The pair has declined so much in recent sessions it has now entered the oversold zone on the Relative Strength Index (RSI), on the 4-hour chart. This suggests the risk of a pullback evolving.
When RSI enters oversold the advice is for traders not to add any new bearish bets to their positions, however, neither should they close their existing shorts.
They should only close existing shorts and open longs when the RSI exits oversold and starts rising again.
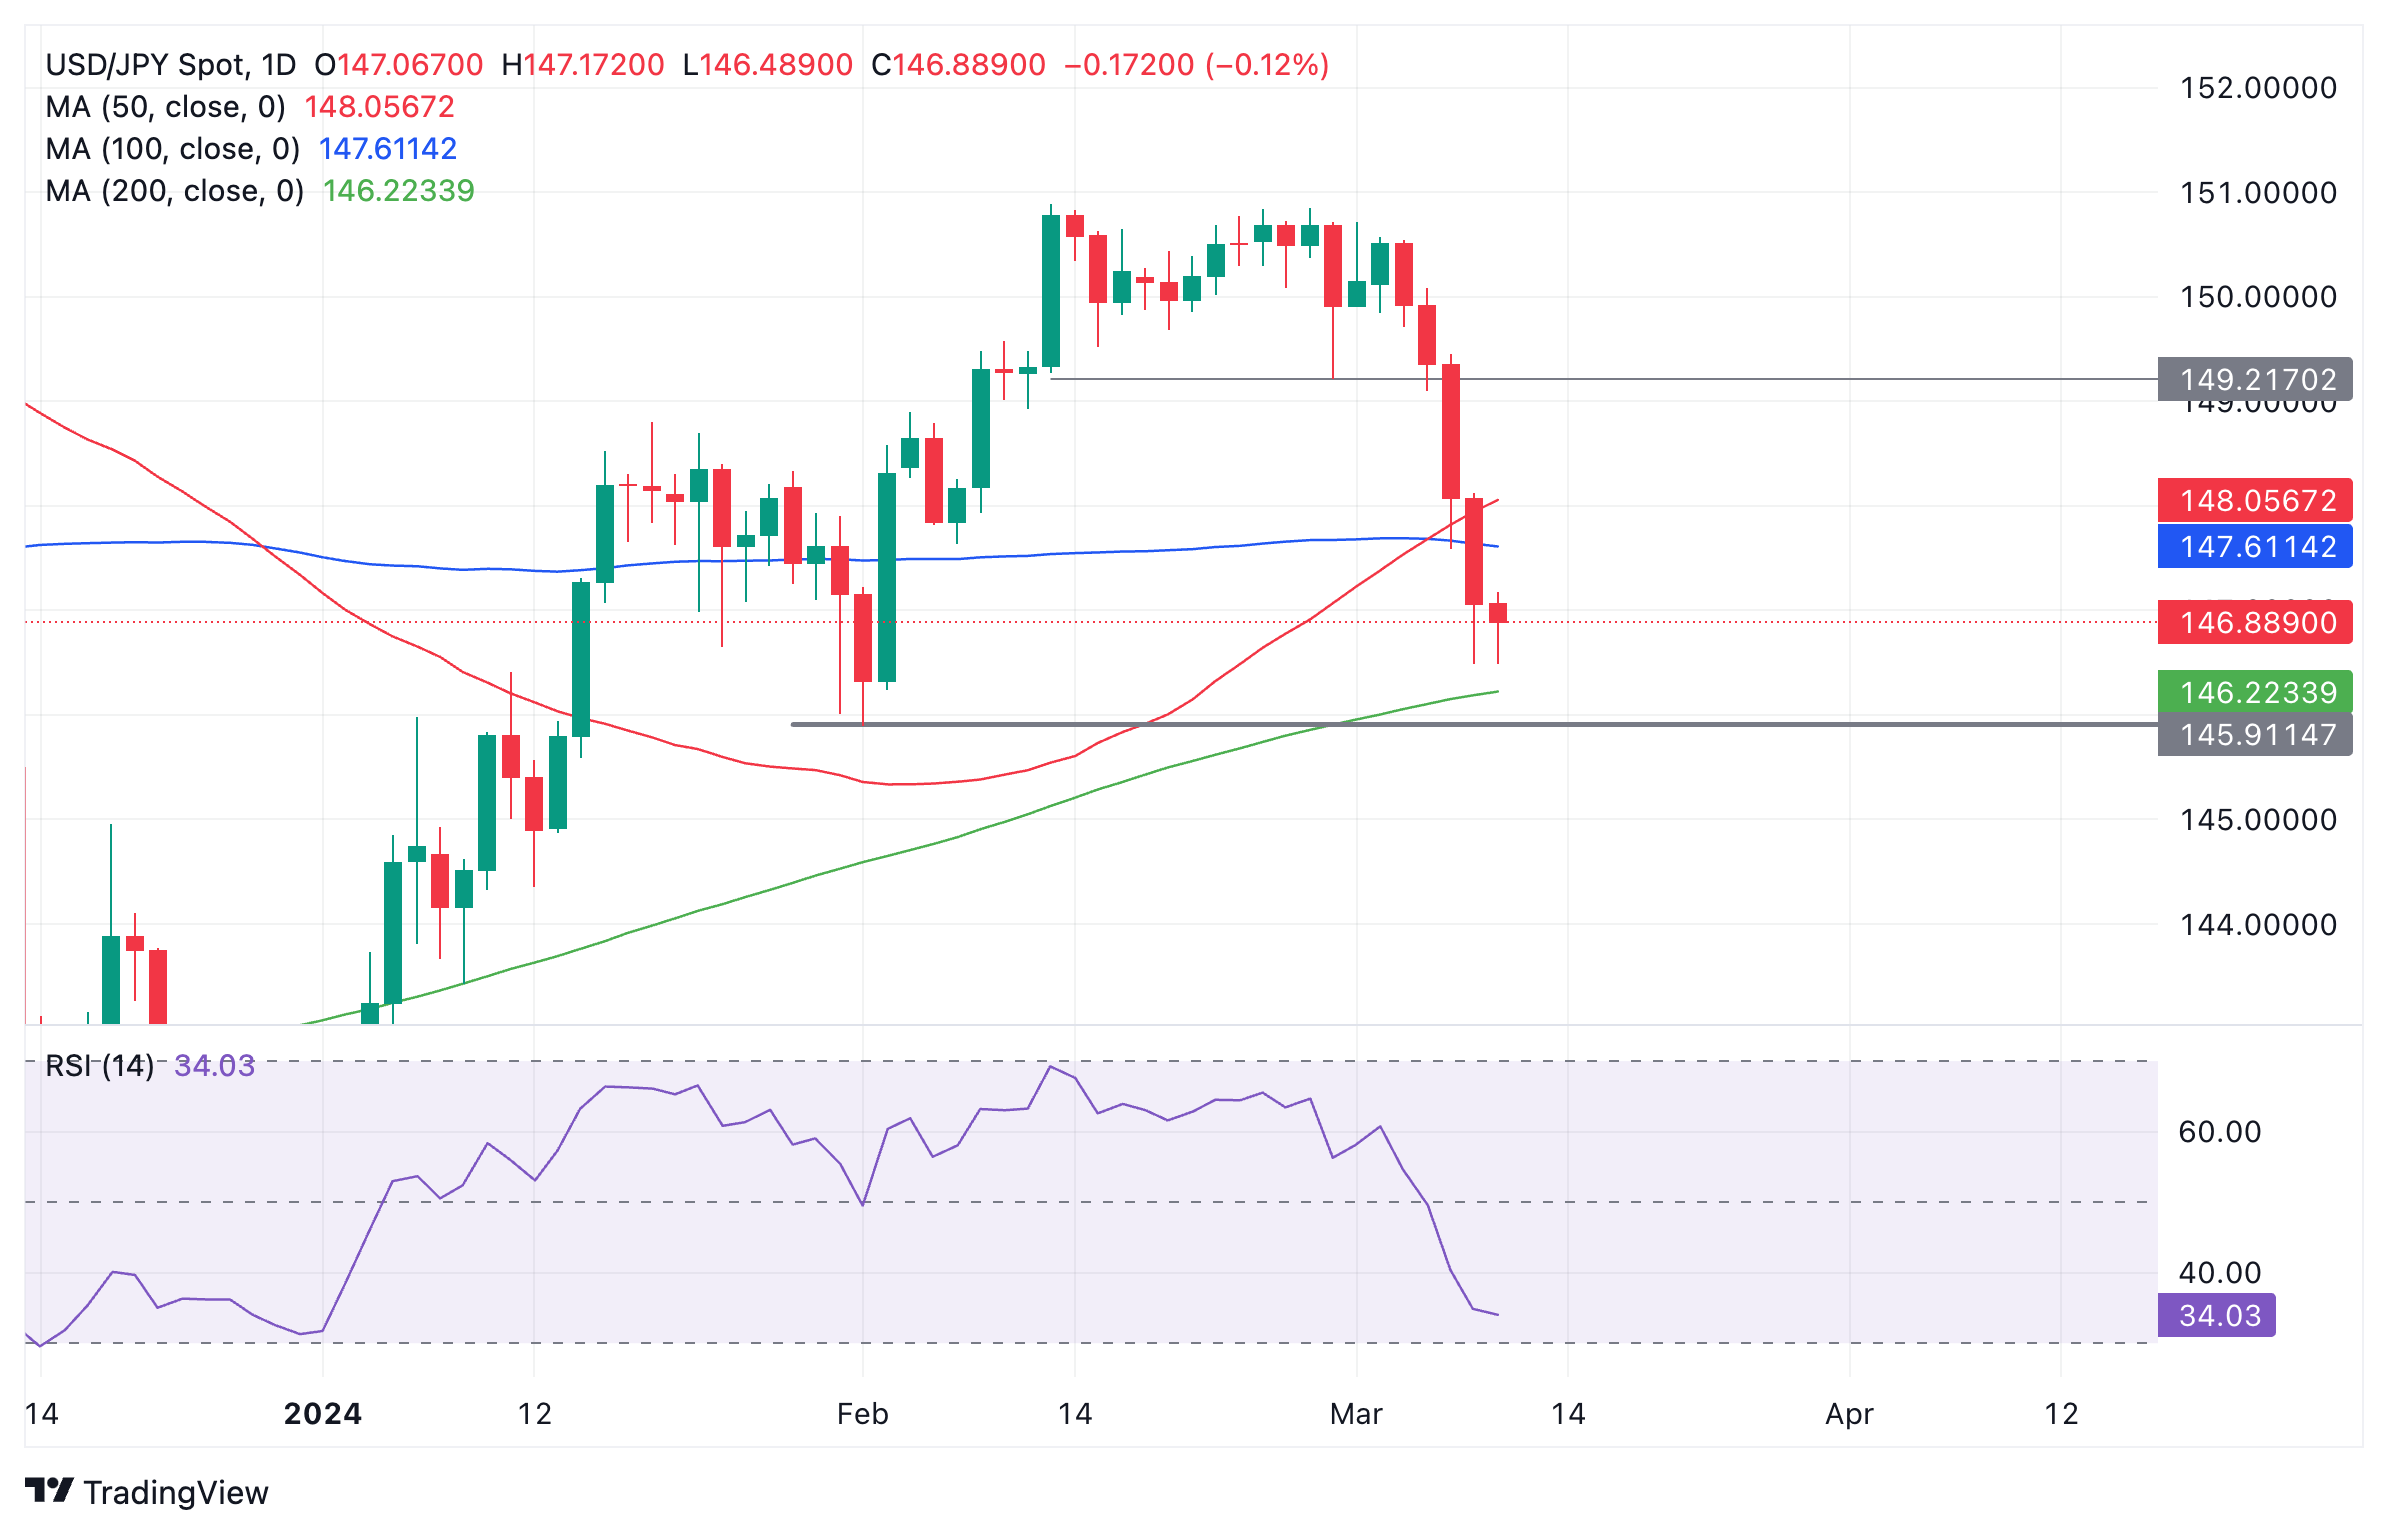
US Dollar vs Japanese Yen: Daily chart
A move higher would probably soon encounter resistance in the region of 147.60-148.00 where the 100 and 50-day Simple Moving Averages (SMA) are situated.
Given the pair is now in a short-term downtrend, however, it will probably eventually rollover and start falling again, back down to the 146.48 March 8 lows.
If the pair breaks below the 146.48 lows it will probably fall to support at the 146.22 and the 200-day SMA, followed by 145.89, the February 1 low.
Author

Joaquin Monfort
FXStreet
Joaquin Monfort is a financial writer and analyst with over 10 years experience writing about financial markets and alt data. He holds a degree in Anthropology from London University and a Diploma in Technical analysis.
















