|

USD/JPY Price Analysis: Dips amid falling US Dollar at the brisk of cracking below 144.00

  • USD/JPY's 0.33% decline influenced by falling US bond yields and a weaker USD, as market anticipates US inflation report.
  • Technical analysis shows bearish trend under Kijun-Sen and Ichimoku Cloud, suggesting potential further declines.
  • Immediate supports at 144.00 and 143.00, while a break above 145.00 could signal an upward shift in momentum.

The USD/JPY begins the week on the back foot with the major sliding 0.33%, weighed by falling US Treasury bond yields and a soft US Dollar (USD). The lack of a catalyst on Monday keeps traders focused on the main event of the week, which is the inflation report in the US. At the time of writing, the pair is exchanging hands at 144.11.

From a technical standpoint, the daily chart suggests the pair is bearishly biased, even though it briefly tested a September 11 swing low of 145.89, though buyers were quickly rejected at that level, achieving a daily close at around 144.59 last Friday.

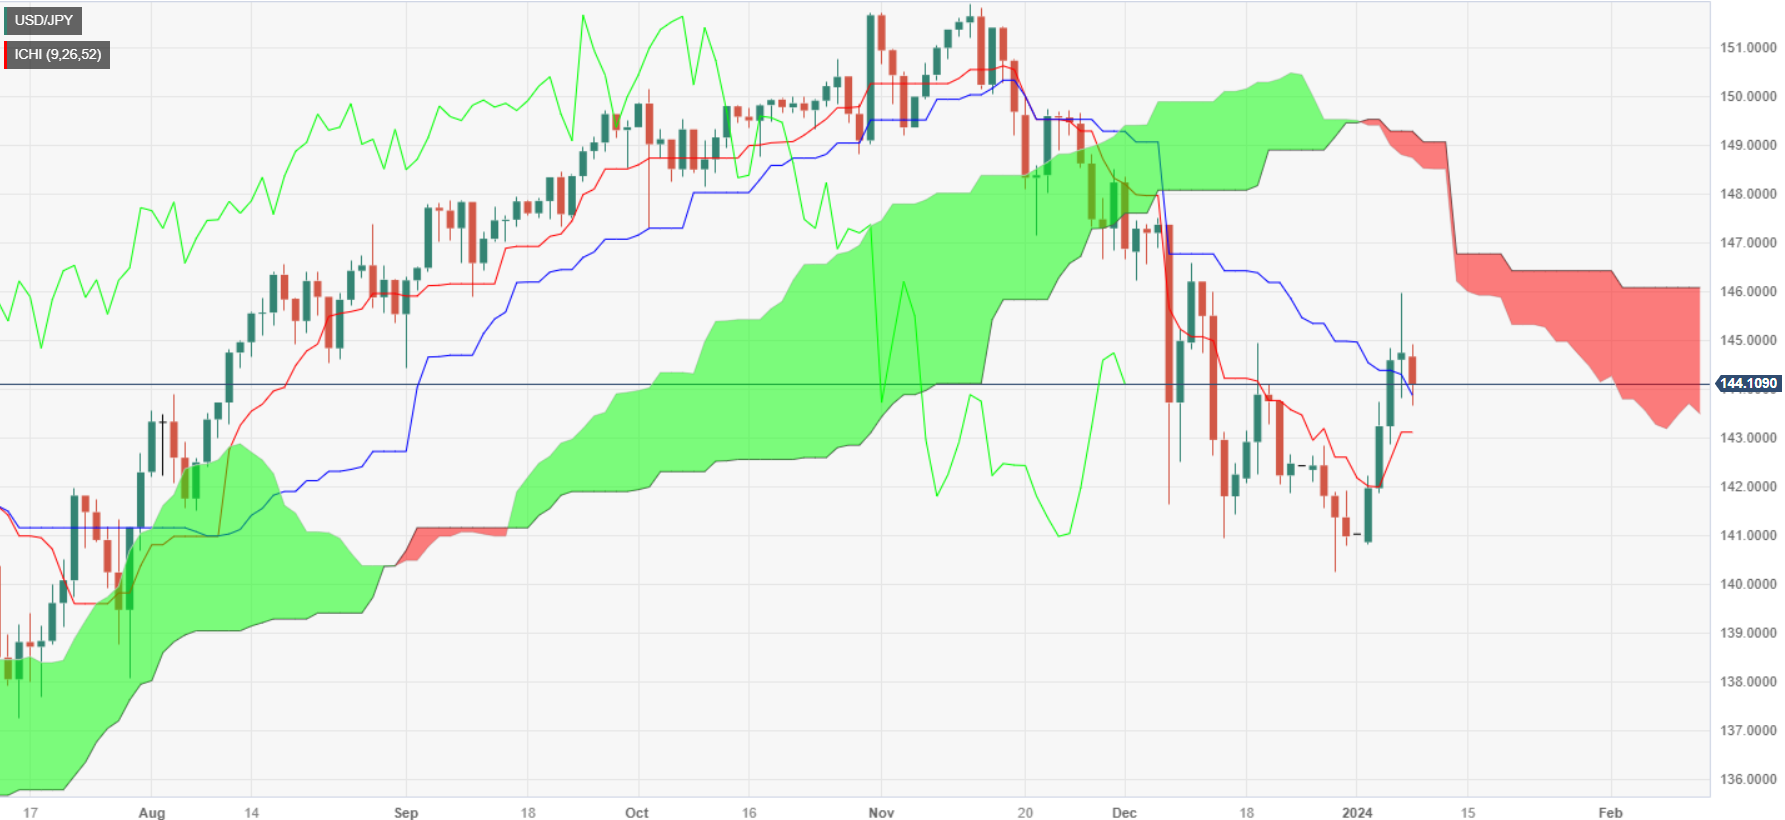
The USD/JPY had remained downward pressured, below the Kijun-Sen and the Ichimoku Cloud (Kumo), suggesting that the downtrend remains in place. That, along with the Chikou Span remaining in bearish territory, would keep sellers hopeful of lowering prices.

The major’s first support is seen at 144.00, followed by the Tenkan-Sen level at 143.11, ahead of the 143.00 mark. Once cleared, up next would be the 142.00 mark, followed by the December 28 swing low of 140.25.

On the other hand, if buyers lift the USD/JPY above 145.00, that will pave the way for further upside.

USD/JPY Price Action – Daily Chart

USD/JPY Technical Levels

USD/JPY

Overview
Today last price144.12
Today Daily Change-0.62
Today Daily Change %-0.43
Today daily open144.74
 
Trends
Daily SMA20142.93
Daily SMA50146.65
Daily SMA100147.42
Daily SMA200143.3
 
Levels
Previous Daily High145.98
Previous Daily Low143.81
Previous Weekly High145.98
Previous Weekly Low140.81
Previous Monthly High148.35
Previous Monthly Low140.25
Daily Fibonacci 38.2%145.15
Daily Fibonacci 61.8%144.64
Daily Pivot Point S1143.71
Daily Pivot Point S2142.67
Daily Pivot Point S3141.53
Daily Pivot Point R1145.88
Daily Pivot Point R2147.02
Daily Pivot Point R3148.06

Author

Christian Borjon Valencia

Markets analyst, news editor, and trading instructor with over 14 years of experience across FX, commodities, US equity indices, and global macro markets.

More from Christian Borjon Valencia
Share:

Editor's Picks

EUR/USD accelerates losses, focus is on 1.1800

EUR/USD’s selling pressure is gathering pace now, opening the door to a potential test of the key 1.1800 region sooner rather than later. The pair’s pullback comes on the back of marked gains in the US Dollar following US data releases and the publication of the FOMC Minutes later in the day.

GBP/USD turns negative near 1.3540

GBP/USD reverses its initial upside momentum and is now adding to previous declines, revisiting at the same time the 1.3540 region on Wednesday. Cable’s downtick comes on the back of decent gains in the Greenback and easing UK inflation figures, which seem to have reinforced the case for a BoE rate cut in March.

Gold picks pace, flirts with $5,000

Gold is back on the front foot on Wednesday, shaking off part of the early week softness and pushing higher towards the key $5,000 mark per troy ounce. The move comes ahead of the FOMC Minutes and is unfolding despite an intense rebound in the US Dollar.

Fed Minutes to shed light on January hold decision amid hawkish rate outlook

The Minutes of the Fed’s January 27-28 monetary policy meeting will be published today. Details of discussions on the decision to leave the policy rate unchanged will be scrutinized by investors.

Mixed UK inflation data no gamechanger for the Bank of England

Food inflation plunged in January, but service sector price pressure is proving stickier. We continue to expect Bank of England rate cuts in March and June. The latest UK inflation read is a mixed bag for the Bank of England, but we doubt it drastically changes the odds of a March rate cut.

Sui extends sideways action ahead of Grayscale’s GSUI ETF launch

Sui is extending its downtrend for the second consecutive day, trading at 0.95 at the time of writing on Wednesday. The Layer-1 token is down over 16% in February and approximately 34% from the start of the year, aligning with the overall bearish sentiment across the crypto market.