|

USD/JPY Price Analysis: Climbs to fresh YTD top, seems poised to appreciate further

  • USD/JPY prolongs its weekly uptrend and climbs to a fresh YTD top on Friday.
  • Sustained USD buying lends support amid uncertainty over BoJ’s policy path.
  • The technical setup supports prospects for an extension of the positive move.

The USD/JPY pair gains strong positive traction on the last day of the week and climbs to a nearly two-month high heading into the North American session. The pair is currently placed around the 135.00 psychological mark and seems poised to build on the recent appreciating move witnessed over the past two weeks or so.

The Japanese Yen (JPY) weakens across the board amid the uncertainty over the path of monetary policy under new Bank of Japan (BoJ) Governor Kazuo Ueda. The US Dollar, on the other hand, hits a fresh six-week high amid expectations that the Federal Reserve will stick to its hawkish stance in the wake of stubbornly high inflation. This turns out to be a key factor pushing the USD/JPY pair higher.

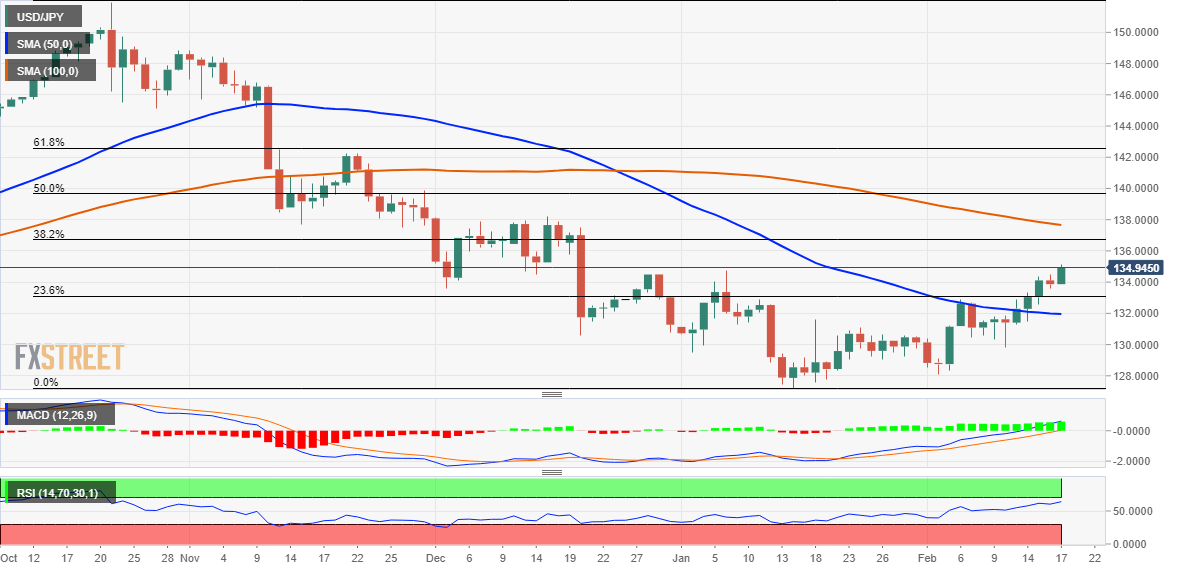
From a technical perspective, this week's sustained break through the 50-day SMA and a subsequent move beyond the 132.90-133.00 supply zone was seen as a key trigger for bullish traders. The latter marks the 38.2% Fibonacci retracement level of the recent sharp pullback from over a three-decade higher touched in October and should now act as a strong near-term base for the USD/JPY pair.

In the meantime, any meaningful slide below the 134.80-134.75 immediate support is likely to attract fresh buyers near the 134.40 region. This, in turn, should help limit the downside for the USD/JPY pair near the 134.00 round-figure mark. That said, a convincing break below might prompt some technical selling and pave the way for a slide back towards the 133.00 strong resistance breakpoint.

On the flip side, the USD/JPY pair seems poised to climb towards the 135.55-135.60 horizontal zone and eventually aim to reclaim the 136.00 mark. The momentum could get extended further towards the 136.75-136.85 confluence resistance, comprising the 38.2% Fibo. level and a technically significant 200-day SMA. A sustained strength beyond will suggest that spot prices have bottomed out.

USD/JPY daily chart

fxsoriginal

Key levels to watch

USD/JPY

Overview
Today last price135
Today Daily Change1.13
Today Daily Change %0.84
Today daily open133.87
 
Trends
Daily SMA20131.05
Daily SMA50132
Daily SMA100137.75
Daily SMA200136.9
 
Levels
Previous Daily High134.46
Previous Daily Low133.6
Previous Weekly High132.91
Previous Weekly Low129.81
Previous Monthly High134.78
Previous Monthly Low127.22
Daily Fibonacci 38.2%133.93
Daily Fibonacci 61.8%134.13
Daily Pivot Point S1133.49
Daily Pivot Point S2133.12
Daily Pivot Point S3132.63
Daily Pivot Point R1134.35
Daily Pivot Point R2134.84
Daily Pivot Point R3135.21

Author

Haresh Menghani

Haresh Menghani is a detail-oriented professional with 10+ years of extensive experience in analysing the global financial markets.

More from Haresh Menghani
Share:

Markets move fast. We move first.

Orange Juice Newsletter brings you expert driven insights - not headlines. Every day on your inbox.

By subscribing you agree to our Terms and conditions.

Editor's Picks

EUR/USD moves sideways below 1.1800 on Christmas Eve

EUR/USD struggles to find direction and trades in a narrow channel below 1.1800 after posting gains for two consecutive days. Bond and stock markets in the US will open at the usual time and close early on Christmas Eve, allowing the trading action to remain subdued. 

GBP/USD keeps range around 1.3500 amid quiet markets

GBP/USD keeps its range trade intact at around 1.3500 on Wednesday. The Pound Sterling holds the upper hand over the US Dollar amid pre-Christmas light trading as traders move to the sidelines heading into the holiday season. 

Gold retreats from record highs, trades below $4,500

Gold retreats after setting a new record-high above $4,520 earlier in the day and trades in a tight range below $4,500 as trading volumes thin out ahead of the Christmas break. The US Dollar selling bias remains unabated on the back of dovish Fed expectations, which continues to act as a tailwind for the bullion amid persistent geopolitical risks.

Bitcoin slips below $87,000 as ETF outflows intensify, whale participation declines

Bitcoin price continues to trade around $86,770 on Wednesday, after failing to break above the $90,000 resistance. US-listed spot ETFs record an outflow of $188.64 million on Tuesday, marking the fourth consecutive day of withdrawals.

Economic outlook 2026-2027 in advanced countries: Solidity test

After a year marked by global economic resilience and ending on a note of optimism, 2026 looks promising and could be a year of solid economic performance. In our baseline scenario, we expect most of the supportive factors at work in 2025 to continue to play a role in 2026.

Stellar Price Forecast: XLM slips below $0.22 as bearish momentum builds

Stellar (XLM) price is trading below $0.22 at the time of writing on Wednesday after failing to close above the key resistance earlier this week. Bearish momentum continues to strengthen, with open interest falling and short bets rising.