|

USD/JPY Price Analysis: Challenges 50-DMA on its three-day uptrend

  • USD/JPY takes out post-FOMC minutes highs to challenge 50-DMA at 110.19.
  • Fed minutes signalled tapering is coming before the end of this year.
  • RSI has pierced through the midline, the tide has turned in favor of bulls.

USD/JPY is challenging four-day highs above 110.00, having taking out the post-FOMC top at 110.07, as the bulls continue to take advantage of the unabated US dollar demand across the board.

The Fed minutes revealed that the officials discussed tapering plans for the latter part of this year when they met in July for the monetary policy review. The greenback bulls were just awaiting this confirmation for advancing further, which drove USD/JPY higher alongside.

However, the bulls could face some stiff resistance on its three-day uptrend, as the Treasury yields are bearing the brunt of the risk-off trading in the global markets, thanks to the covid woes and tapering fears.

Technically, USD/JPY needs to crack the 50-Daily Moving Average (DMA) at 110.19 on a sustained basis to unleashing the recovery towards the August 13 highs of 110.46.

Further up, the buyers will target the August 11 highs of 110.80.

The daily Relative Strength Index (RSI) has pierced through the midline, reclaiming the bullish territory, which suggests that the tide has turned in favor of the optimists.

USD/JPY daily chart

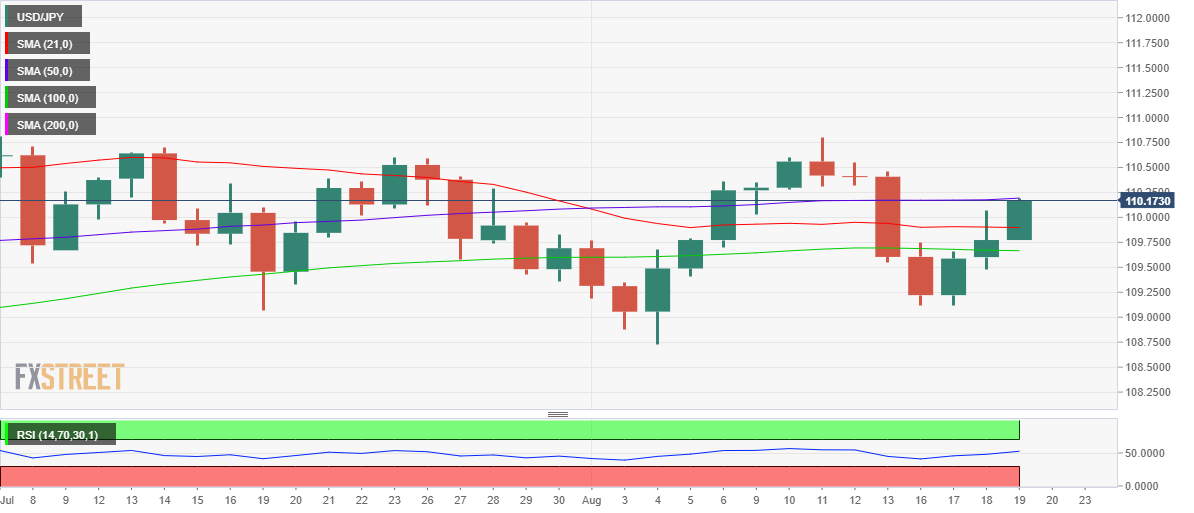
On the flip side, horizontal 21-DMA offers immediate support at 109.89, below which the daily low at 109.77 will get tested.

The last resort for USD/JPY buyers is envisioned at the 100-DMA cap at 109.66.

USD/JPY additional levels to watch

USD/JPY

Overview
Today last price110.17
Today Daily Change0.41
Today Daily Change %0.37
Today daily open109.77
 
Trends
Daily SMA20109.88
Daily SMA50110.18
Daily SMA100109.67
Daily SMA200107.48
 
Levels
Previous Daily High110.07
Previous Daily Low109.48
Previous Weekly High110.8
Previous Weekly Low109.55
Previous Monthly High111.66
Previous Monthly Low109.06
Daily Fibonacci 38.2%109.84
Daily Fibonacci 61.8%109.7
Daily Pivot Point S1109.48
Daily Pivot Point S2109.18
Daily Pivot Point S3108.89
Daily Pivot Point R1110.07
Daily Pivot Point R2110.36
Daily Pivot Point R3110.65

Author

Dhwani Mehta

Dhwani Mehta

FXStreet

Residing in Mumbai (India), Dhwani is a Senior Analyst and Manager of the Asian session at FXStreet. She has over 10 years of experience in analyzing and covering the global financial markets, with specialization in Forex and commodities markets.

More from Dhwani Mehta
Share:

Editor's Picks

AUD/USD looks weaker, focus is back to 0.7100

AUD/USD reverses Tuesday’s gains and retreats markedly toward four-day troughs in the low 0.7100s ahead of the opening bell in Asia. The firmer tone in the Greenback weighs on the risk complex amid unabated tensions on the US-Iran front, prompting the Aussie to shed part of recent gains and refocus on the downside. Moving forward, Australian trade balance results should entertain investors early on Thursday.

Japanese Yen bounces up from lows after Japan PM Takaichi’s intervention warnings

The Japanese Yen bounced up from five-week lows against the US Dollar, turning positive on the daily chart, as Japan’s Prime Minister Sanae Takaichi warned that Tokyo is ready to take action against Yen weakness. The USD/JPY pair has pulled back from the 160.00 level, considered a line in the sand for Japanese authorities, to hit session lows at 159.55.

Gold remains under bearish pressure, looks at $4,400

Gold keeps the offered stance well in place, retreating toward the $4,430 region per troy ounce, or four-day lows, on Wednesday. The yellow metal’s retracement comes in response to escalating tensions in the Middle East, which in turn continue to drive oil prices higher while reinforcing the idea of a tighter-for-longer Fed.


XRP eyes rebound despite muted ETF demand
Ripple (XRP) rebounds above $1.23 from support at $1.20 at the time of writing on Wednesday, as the broader cryptocurrency market pares losses triggered by escalating tensions in the Middle East. Appetite for risk assets remains generally low as the United States (US) and Iran exchange fire amid a fragile ceasefire and peace negotiations.
The upside-down math of debt
In 2010, Professors Carmen Reinhart and Kenneth Rogoff published a paper, Growth in a Time of Debt, which instantly went viral. The main thesis of the paper was that once a government's debt-to-GDP ratio crosses above 90%, a financial crisis and default are around the corner.
Recession on paper: What really moves the Canadian Loonie now?

Statistics Canada handed the headline writers a gift and the analysts a headache. Real GDP shrank 0.1% on an annualized basis in the first quarter, and with the fourth quarter of 2025 revised down to a 1.0% contraction, that is two negative quarters in a row, the textbook definition of a technical recession and Canada's first since the pandemic.