USD/JPY Price Analysis: Breaks monthly resistance to refresh weekly top above 104.00
- USD/JPY eases from intraday high, keeps trend line breakout.
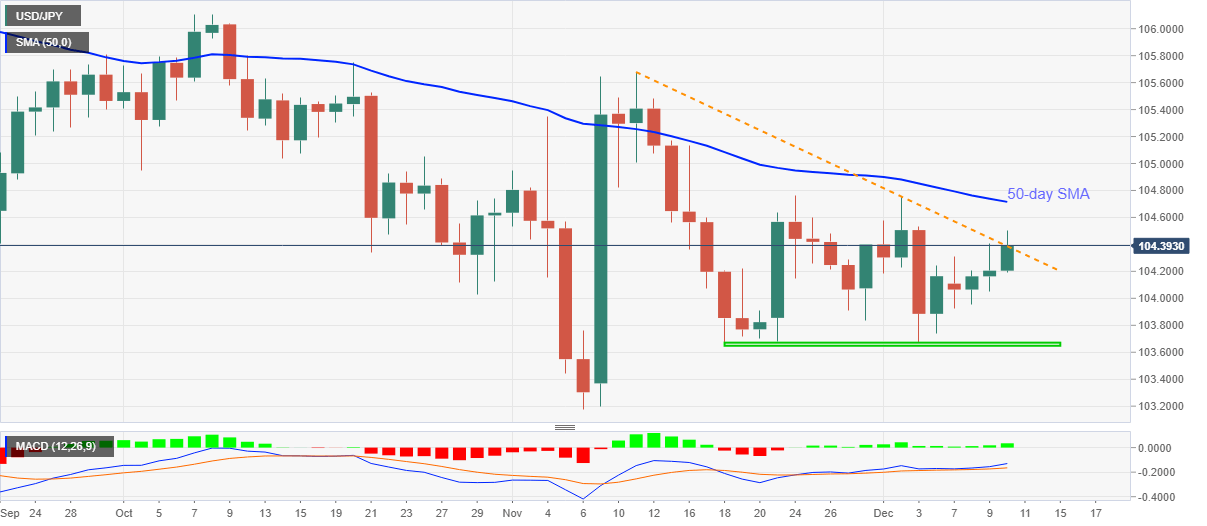
- Bullish MACD, sustained break of previous resistance eyes 50-day SMA.
- Three-week-old horizontal support restricts short-term downside.

USD/JPY cools down from a weekly high of 104.50 to 104.40, still up 0.18% intraday, during the pre-European open trading on Thursday. The pair recently pierced a downward sloping trend line from November 11 while printing a three-day winning streak.
Not only the upside break of the previous resistance line but bullish MACD also directs USD/JPY buyers toward the 50-day SMA level of 104.71.
It should, however, be noted that the monthly top near 104.75 will add filters to the quote’s upside past-50-day SMA.
Meanwhile, failures to keep the trend line breakout, at 104.38 now, on a daily closing basis can recall the 104.00 threshold back to the charts.
Though, multiple lows marked since November 18, near 103.70/65, will be a tough nut to crack for USD/JPY sellers past-104.00.
USD/JPY daily chart
Trend: Further upside expected
Author

Anil Panchal
FXStreet
Anil Panchal has nearly 15 years of experience in tracking financial markets. With a keen interest in macroeconomics, Anil aptly tracks global news/updates and stays well-informed about the global financial moves and their implications.


