|

USD/JPY Price Analysis: Bears occupy driver’s seat near 139.00 amid talks of BoJ’s YCC tweak

  • USD/JPY remains pressured at the lowest level in a week, prints five-day downtrend ahead of Japan inflation, BoJ.
  • Chatters that BoJ will drop its 0.5% limit on the 10-year JGB bolstered Yen during late Thursday.
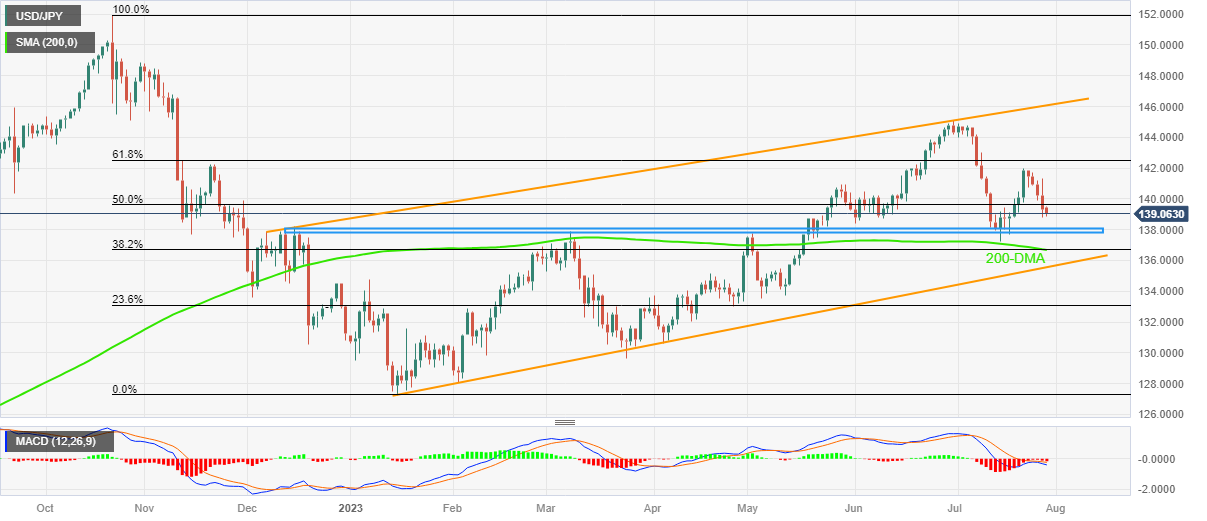
  • Bears approach yearly horizontal support within rising trend channel established since December 2022, recovery remains elusive below May’s peak.
  • Bearish MACD signals, downside break of 50% Fibonacci retracement keep Yen pair sellers hopeful.

USD/JPY bears flirt with the 139.00 round figure during a five-day losing streak ahead of Friday’s Tokyo open. In doing so, the Yen pair justifies the latest chatters surrounding the Bank of Japan’s (BoJ) likely edit to the +/- 0.50% limit of the 10-year Japanese Government Bond (JGB) yields ahead of Japan inflation data and the BoJ monetary policy announcements.

Also read: Breaking: USD/JPY bears firm on a strong hint that BoJ will drop 0.5% cap in 10Y JGB yields

Technically, the bearish MACD signals join the Yen pair’s downside break of the 50% Fibonacci retracement level of October 2022 to January 2023 fall, near 139.60 by the press time, to favor the USD/JPY sellers.

With this, the Yen pair appears well set to prod the horizontal area comprising multiple levels marked since December 2022, close to 138.00-137.80.

Following that, a convergence of the 200-DMA and 38.2% Fibonacci retracement, close to 136.70, will precede the bottom line of a seven-month-old rising channel surrounding 135.60, to limit the USD/JPY downside.

On the contrary, a 50% Fibonacci retracement level of 139.60 and the 140.00 round figure may initially restrict the USD/JPY recovery ahead of directing the bulls to May’s high of near 140.95, quickly followed by the 141.00 round figure.

It’s worth noting, however, that the Yen pair buyers will remain confused unless witnessing a clear upside break of the 61.8% Fibonacci retracement level of 142.52, backed by the dovish BoJ stand.

USD/JPY: Daily chart

Trend: Limited downside expected

Additional important levels

Overview
Today last price139.08
Today Daily Change-1.16
Today Daily Change %-0.83%
Today daily open140.24
 
Trends
Daily SMA20141.39
Daily SMA50140.88
Daily SMA100137.32
Daily SMA200136.79
 
Levels
Previous Daily High141.18
Previous Daily Low139.92
Previous Weekly High141.96
Previous Weekly Low137.68
Previous Monthly High145.07
Previous Monthly Low138.43
Daily Fibonacci 38.2%140.4
Daily Fibonacci 61.8%140.7
Daily Pivot Point S1139.72
Daily Pivot Point S2139.19
Daily Pivot Point S3138.45
Daily Pivot Point R1140.98
Daily Pivot Point R2141.71
Daily Pivot Point R3142.24

Author

Anil Panchal

Anil Panchal

FXStreet

Anil Panchal has nearly 15 years of experience in tracking financial markets. With a keen interest in macroeconomics, Anil aptly tracks global news/updates and stays well-informed about the global financial moves and their implications.

More from Anil Panchal
Share:

Markets move fast. We move first.

Orange Juice Newsletter brings you expert driven insights - not headlines. Every day on your inbox.

By subscribing you agree to our Terms and conditions.

Editor's Picks

EUR/USD bears await break below 100-day SMA support near 1.1665 area

The EUR/USD pair attracts heavy selling for the second straight day and dives to a nearly four-week trough, around the 1.1670 region, during the Asian session on Monday. Bearish traders now await a sustained break below the 100-day Simple Moving Average before positioning for an extension of the recent pullback from a three-month top, or levels just above the 1.1800 mark touched on December 24.

GBP/USD falls toward 1.3400 near 50-day EMA

GBP/USD extends its losses for the second successive session, trading around 1.3420 during the Asian hours on Monday. The technical analysis of the daily chart indicates that the 14-day Relative Strength Index at 53 has eased from near overbought, indicating that momentum has cooled while remaining above the midline. RSI holds above 50, keeping a modest bullish bias.

Gold on fire at the start of the week on US-Venezuela tensions

Gold regains upside traction early Monday as flight to safety prevails on Venezuela turmoil. The US Dollar finds strong haven demand, caps Gold’s upside as focus shifts to US jobs data. Gold’s daily technical setup suggests that more upside remains in the offing.

Bulls firmly in control as Bitcoin breaks $93K, Ethereum and Ripple extend gains

Bitcoin, Ethereum, and Ripple extended their rallies on Monday, gaining more than 4%, 6%, and 12%, respectively, in the previous week. The top three cryptocurrencies by market capitalization could continue to outperform, with bulls in control of the momentum.

Economic outlook 2026-2027 in advanced countries: Solidity test

After a year marked by global economic resilience and ending on a note of optimism, 2026 looks promising and could be a year of solid economic performance. In our baseline scenario, we expect most of the supportive factors at work in 2025 to continue to play a role in 2026.

Meme Coins Price Prediction: Dogecoin, Shiba Inu, Pepe rally on Venezuela’s shadow BTC reserve

Meme coins such as Dogecoin, Shiba Inu, and Pepe are leading the cryptocurrency market rally driven by the US cross-border operation to capture Venezuelan President Nicolás Maduro. Dogecoin extends its gain for the fifth consecutive day while SHIB and PEPE take a pause.