|

USD/JPY Price Analysis: Bears eye a break of key lower timeframe structures

  • USD/JPY offers a compelling bearish playbook on a 15-minute chart and a break of 144.56 could be on the cards.
  • The daily chart's broadening formation is a bullish feature.

for the immediate future. This could open up a dominos effect with 144.05 next in line. 

USD/JPY bulls have taken the price towards the 145 area as the US dollar continues to attract a bid. On a longer-term basis, the price is technically bullish as per the following analysis pom the daily time frame. However, should the bulls fail to break higher immediately, there is going to be a significant risk of a strong correction to the downside in the coming sessions. 

USD/JPY daily chart

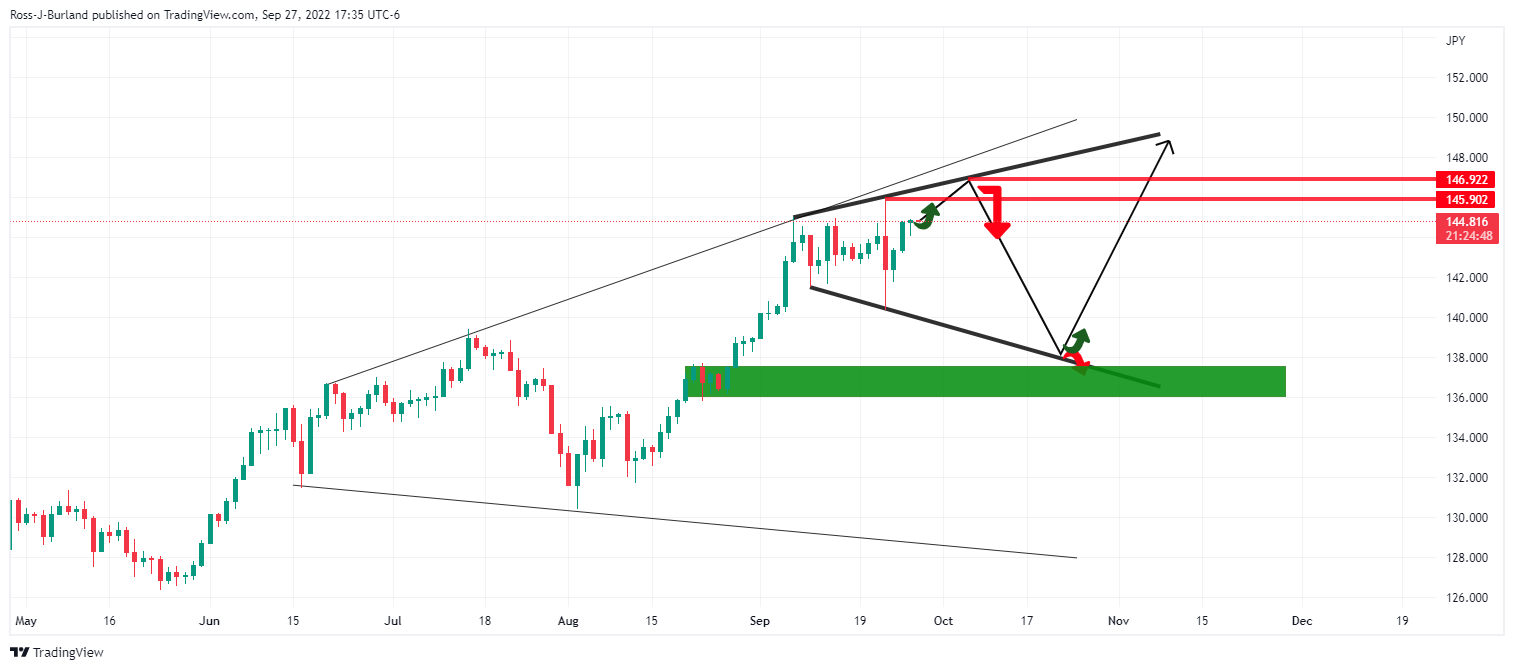
The broadening formation is bullish at this juncture but 147.00 or there abouts could be the most we will see from any upside extension. The first hurdle will be a break of the recent daily highs near 145.90.

USD/JPY M15 chart

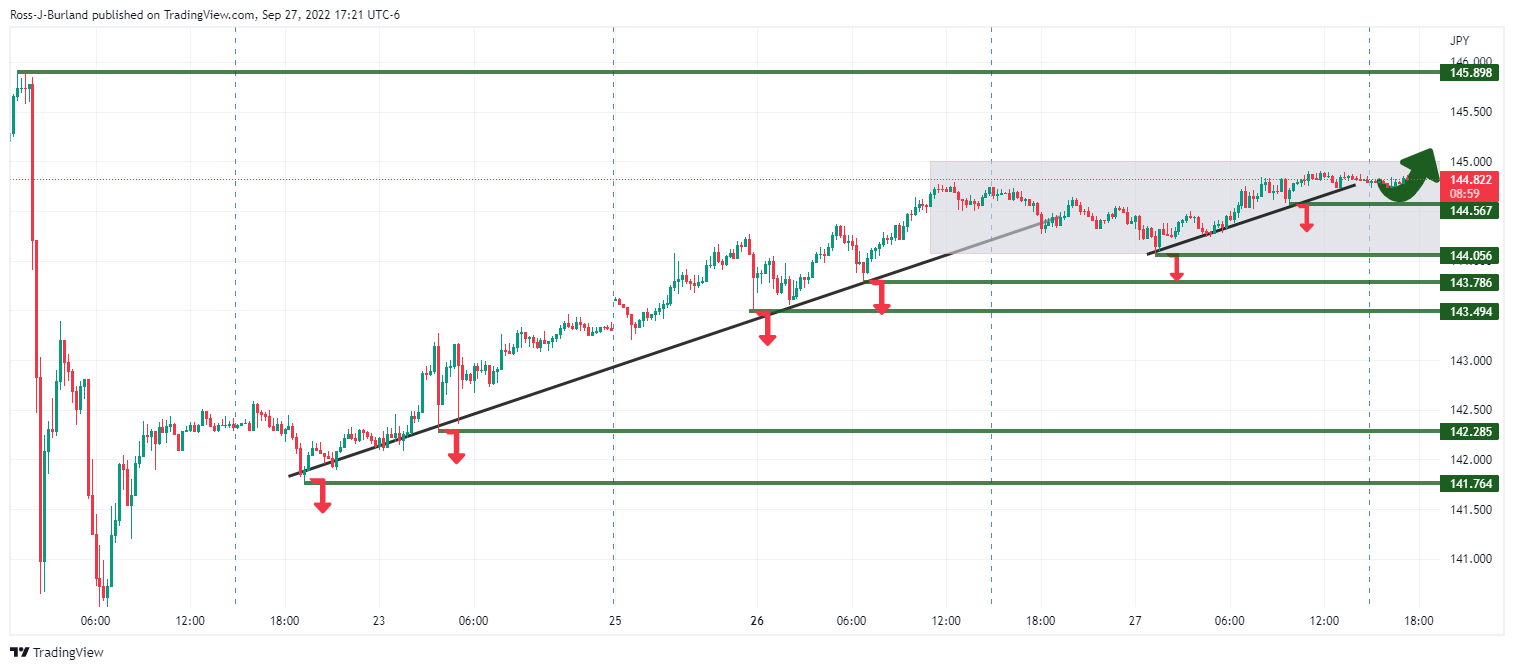
The lower time frame structures are highlighted above on the 15-minute chart and a break of 144.56 could be on the cards for the immediate future. This could open up a dominos effect with 144.05 next in line. 

Author

Ross J Burland

Ross J Burland, born in England, UK, is a sportsman at heart. He played Rugby and Judo for his county, Kent and the South East of England Rugby team.

More from Ross J Burland
Share:

Editor's Picks

EUR/USD treads water above 1.1850 amid thin trading

EUR/USD stays defensive but holds 1.1850 amid quiet markets in the European hours on Monday.  The US Dollar is struggling for direction due to thin liquidity conditions as US markets are closed in observance of Presidents' Day. 

GBP/USD flat lines as traders await key UK and US macro data

GBP/USD kicks off a new week on a subdued note and oscillates in a narrow range near 1.365 in Monday's European trading. The mixed fundamental backdrop warrants some caution for aggressive traders as the market focus now shifts to this week's important releases from the UK and the US.

Gold sticks to intraday losses; lacks follow-through

Gold remains depressed through the early European session on Monday, though it has managed to rebound from the daily trough and currently trades around the $5,000 psychological mark. Moreover, a combination of supporting factors warrants some caution for aggressive bearish traders, and before positioning for deeper losses.

Bitcoin, Ethereum and Ripple consolidate within key ranges as selling pressure eases

Bitcoin and Ethereum prices have been trading sideways within key ranges following the massive correction. Meanwhile, XRP recovers slightly, breaking above the key resistance zone. The top three cryptocurrencies hint at a potential short-term recovery, with momentum indicators showing fading bearish signs.

Global inflation watch: Signs of cooling services inflation

Realized inflation landed close to expectations in January, as negative base effects weighed on the annual rates. Remaining sticky inflation is largely explained by services, while tariff-driven goods inflation remains limited even in the US.

Ripple Price Forecast: XRP potential bottom could be in sight

Ripple edges up above the intraday low of $1.35 at the time of writing on Friday amid mixed price actions across the crypto market. The remittance token failed to hold support at $1.40 the previous day, reflecting risk-off sentiment amid a decline in retail and institutional sentiment.