|

USD/JPY Price Analysis: Bearish triangle highlights 139.30 for Yen traders

  • USD/JPY extends previous day’s fall within one-week-old bearish chart formation.
  • Sustained trading below 100-EMA, bearish MACD signals favor Yen pair sellers.
  • RSI conditions suggest bottom-picking around golden Fibonacci ratio.
  • Multiple hurdles stand tall to challenge Yen buyers.

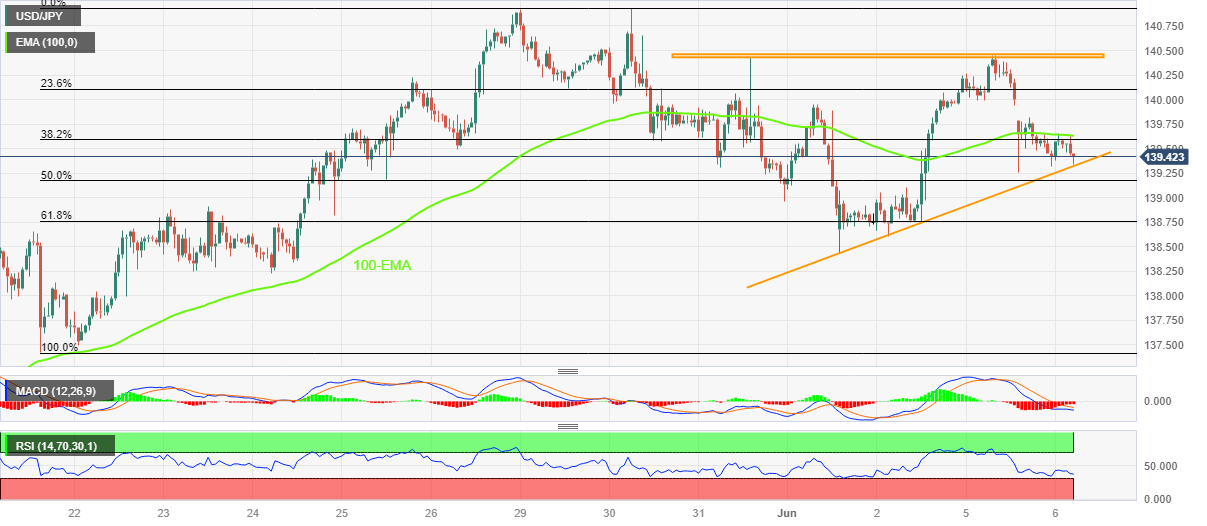
USD/JPY holds a lower ground near the intraday bottom surrounding 139.35 heading into Tuesday’s European session. In doing so, the Japan Yen (JPY) pair defends the previous day’s bearish bias with a one-week-old ascending triangle formation.

Apart from the bearish triangle, the downbeat MACD signals and the quote’s sustained trading below the 100-Exponential Moving Average (EMA) also favor the USD/JPY sellers.

However, a clear downside break of the stated triangles’ bottom line, around 139.30 by the press time, becomes necessary for the Yen pair seller’s confirmation.

Even so, the RSI (14) is near the oversold region and hence the 61.8% Fibonacci retracement of its May 19-30 upside, near 138.75, also known as the golden Fibonacci ratio, can challenge the USD/JPY bears.

In a case where the Yen pair drops below 138.75 Fibonacci support, the 138.00 round figure and the early May peak of around 137.70 could gain the market’s attention.

On the flip side, the 100-EMA level of 139.65 restricts the immediate upside of the USD/JPY pair. Following that, the 140.00 psychological magnet and the stated triangle’s top line near 140.45-50, can challenge the bulls ahead of directing them to the multi-month high marked in May around 140.91.

USD/JPY: Hourly chart

Trend: Further downside expected

Additional important levels

Overview
Today last price139.41
Today Daily Change-0.17
Today Daily Change %-0.12%
Today daily open139.58
 
Trends
Daily SMA20138.09
Daily SMA50135.48
Daily SMA100134.07
Daily SMA200137.3
 
Levels
Previous Daily High140.45
Previous Daily Low139.25
Previous Weekly High140.93
Previous Weekly Low138.43
Previous Monthly High140.93
Previous Monthly Low133.5
Daily Fibonacci 38.2%139.71
Daily Fibonacci 61.8%139.99
Daily Pivot Point S1139.07
Daily Pivot Point S2138.56
Daily Pivot Point S3137.87
Daily Pivot Point R1140.27
Daily Pivot Point R2140.96
Daily Pivot Point R3141.48

Author

Anil Panchal

Anil Panchal

FXStreet

Anil Panchal has nearly 15 years of experience in tracking financial markets. With a keen interest in macroeconomics, Anil aptly tracks global news/updates and stays well-informed about the global financial moves and their implications.

More from Anil Panchal
Share:

Markets move fast. We move first.

Orange Juice Newsletter brings you expert driven insights - not headlines. Every day on your inbox.

By subscribing you agree to our Terms and conditions.

Editor's Picks

EUR/USD holds above 1.1750 due to cautious trade before FOMC Minutes

EUR/USD holds ground after four days of little losses, trading around 1.1770 during the Asian hours on Tuesday. The pair remains steady as US Dollar moves little amid market caution ahead of the Federal Open Market Committee December Meeting Minutes due later in the day, which could offer insights into the Federal Reserve’s 2026 outlook.

GBP/USD finds key support near 1.35 despite year-end grind

GBP/USD remains bolstered on the high end as markets grind through the last trading week of the year. Cable caught a bullish tilt to keep price action on the high side of the 1.3500 handle, though year-end holiday volumes are unlikely to see significant progress in either direction as 2025 draws to a close.

Gold gains on Fed rate cut bets, safe-haven demand

Gold price edges higher above $4,350 during the Asian trading hours on Tuesday. The precious metal recovers some lost ground after falling 4.5% in the previous session, which was gold's largest single-day loss since October. Increased margin requirements on gold and silver futures by the Chicago Mercantile Exchange Group, one of the world’s largest trading floors for commodities, prompted widespread profit-taking and portfolio rebalancing.

Solana risks correction within descending wedge as bearish bets rise

Solana hovers above $120 at press time on Tuesday after a nearly 2% decline on Monday. The SOL-focused Exchange Traded Funds see renewed interest after recording their lowest weekly inflow last week.

Economic outlook 2026-2027 in advanced countries: Solidity test

After a year marked by global economic resilience and ending on a note of optimism, 2026 looks promising and could be a year of solid economic performance. In our baseline scenario, we expect most of the supportive factors at work in 2025 to continue to play a role in 2026.

Crypto market outlook for 2026

Year 2025 was volatile, as crypto often is.  Among positive catalysts were favourable regulatory changes in the U.S., rise of Digital Asset Treasuries (DAT), adoption of AI and tokenization of Real-World-Assets (RWA).