|

USD/JPY Price Analysis: Back above 134.00, as bulls moved in and crushed the 200-DMA

  • USD/JPY rallies above 134.00 after breaking above the 200-day EMA.
  • USD/JPY Price Analysis: Upward biased, though a daily close above the 200-DMA could cement the uptrend.

The USD/JPY rallies more than 100 pips and clears the 134.00 mark, breaking north of the 200-day Exponential Moving Average (EMA) at 133.77, a bullish/bearish bias measure for an asset. Hence, the USD/JPY shifted bullish during the session, though a daily close above the 200-day EMA would keep bulls hopeful for further upside. At the time of writing, the USD/JPY exchanges hand at 134.28 after hitting a low of 132.54.

From a daily chart perspective, the USD/JPY shifted upward biased after dropping from last year’s high of 151.94 towards the YTD low of 127.21 on January 16. Nevertheless, the USD/JPY needs to clear the confluence of the 100-day EMA and the YTD high at 134.77 to cement the uptrend.

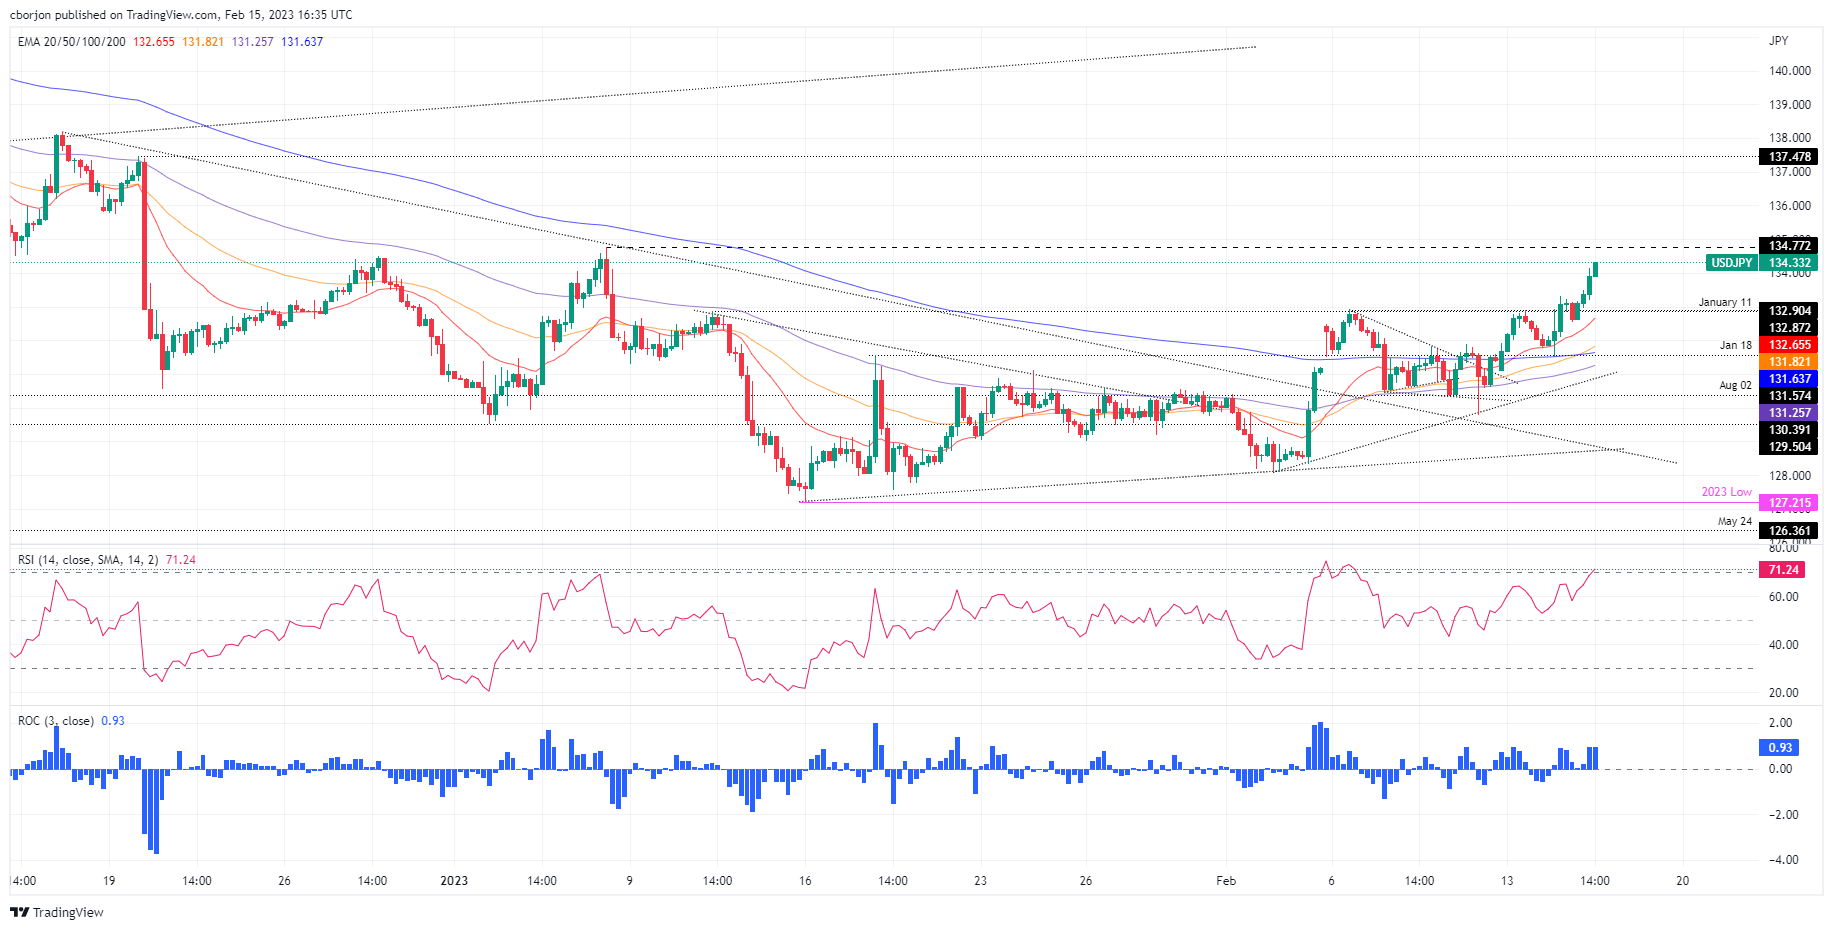
The Relative Strength Index (RSI) and the Rate of Change (RoC) show that buyers are gathering momentum. Hence, the USD/JPY might test the 135.00 psychological level in the near term.

The USD/JPY 4-hour chart depicts the pair as bullish biased after breaking from the 131.70-133.00 consolidation range, eyeing to test the YTD high at 134.77. Even though the RSI shifted overbought, as long as it stays below 80, it portrays the USD/JPY in a strong uptrend. The RoC shows buyers are in control and might continue to ride the trend.

Therefore, the USD/JPY first resistance would be the YTD high at 134.77. A breach of the latter and the pair might get to 135.00, followed by 136.00, and then the December 19 daily high of 137.47.

USD/JPY 4-Hour chart

USD/JPY Key technical levels

USD/JPY

Overview
Today last price134.21
Today Daily Change1.17
Today Daily Change %0.88
Today daily open133.04
 
Trends
Daily SMA20130.51
Daily SMA50132.1
Daily SMA100137.96
Daily SMA200136.85
 
Levels
Previous Daily High133.32
Previous Daily Low131.5
Previous Weekly High132.91
Previous Weekly Low129.81
Previous Monthly High134.78
Previous Monthly Low127.22
Daily Fibonacci 38.2%132.62
Daily Fibonacci 61.8%132.19
Daily Pivot Point S1131.92
Daily Pivot Point S2130.8
Daily Pivot Point S3130.11
Daily Pivot Point R1133.74
Daily Pivot Point R2134.43
Daily Pivot Point R3135.55

Author

Christian Borjon Valencia

Christian Borjon began his career as a retail trader in 2010, mainly focused on technical analysis and strategies around it. He started as a swing trader, as he used to work in another industry unrelated to the financial markets.

More from Christian Borjon Valencia
Share:

Markets move fast. We move first.

Orange Juice Newsletter brings you expert driven insights - not headlines. Every day on your inbox.

By subscribing you agree to our Terms and conditions.

Editor's Picks

EUR/USD moves sideways below 1.1800 on Christmas Eve

EUR/USD struggles to find direction and trades in a narrow channel below 1.1800 after posting gains for two consecutive days. Bond and stock markets in the US will open at the usual time and close early on Christmas Eve, allowing the trading action to remain subdued. 

GBP/USD keeps range around 1.3500 amid quiet markets

GBP/USD keeps its range trade intact at around 1.3500 on Wednesday. The Pound Sterling holds the upper hand over the US Dollar amid pre-Christmas light trading as traders move to the sidelines heading into the holiday season. 

Gold retreats from record highs, trades below $4,500

Gold retreats after setting a new record-high above $4,520 earlier in the day and trades in a tight range below $4,500 as trading volumes thin out ahead of the Christmas break. The US Dollar selling bias remains unabated on the back of dovish Fed expectations, which continues to act as a tailwind for the bullion amid persistent geopolitical risks.

Bitcoin slips below $87,000 as ETF outflows intensify, whale participation declines

Bitcoin price continues to trade around $86,770 on Wednesday, after failing to break above the $90,000 resistance. US-listed spot ETFs record an outflow of $188.64 million on Tuesday, marking the fourth consecutive day of withdrawals.

Economic outlook 2026-2027 in advanced countries: Solidity test

After a year marked by global economic resilience and ending on a note of optimism, 2026 looks promising and could be a year of solid economic performance. In our baseline scenario, we expect most of the supportive factors at work in 2025 to continue to play a role in 2026.

Avalanche struggles near $12 as Grayscale files updated form for ETF

Avalanche trades close to $12 by press time on Wednesday, extending the nearly 2% drop from the previous day. Grayscale filed an updated form to convert its Avalanche-focused Trust into an ETF with the US Securities and Exchange Commission.