USD/JPY Price Analysis: A bearish-wedge formation opens the door for a correction towards 113.50
- USD/JPY found strong resistance around the 115.00-20 area, near the top-trendline of a bearish-wedge formation.
- Risk-off market sentiment failed to benefit the Japanese yen, though higher US Treasury yields boosted the greenback.
- USD/JPY: Mid-term has an upward bias, but a bearish-wedge formation could push the pair towards 113.50 before resuming to the upside.

The USD/JPY extends its gains throughout the New York session, trading at 115.00 up some 0.15% at the time of writing. Risk-off market sentiment weighs on in US equities, as most indices fall, between 0.48% and 1.42%, except for the Dow Jones Industrial, which is flat at the day.
During the Asian and European sessions, the USD/JPY seesawed around the 114.54-115.15 range. In the Asian session, the USD/JPY spiked to the 115.14 area, though later retreated the upward move, down to the daily central pivot point around 114.50s, where the pair stalled, before resuming the uptrend.
The 10-year US Treasury yield closes to 1.70%
In the meantime, the US T-bond 10-year benchmark note, advances three and a half basis points, sitting at 1.662%, benefits the greenback. The US Dollar Index, which measures the greenback’s performance against a basket of six rivals, is flat at 96.51.
USD/JPY Price Forecast: Technical outlook
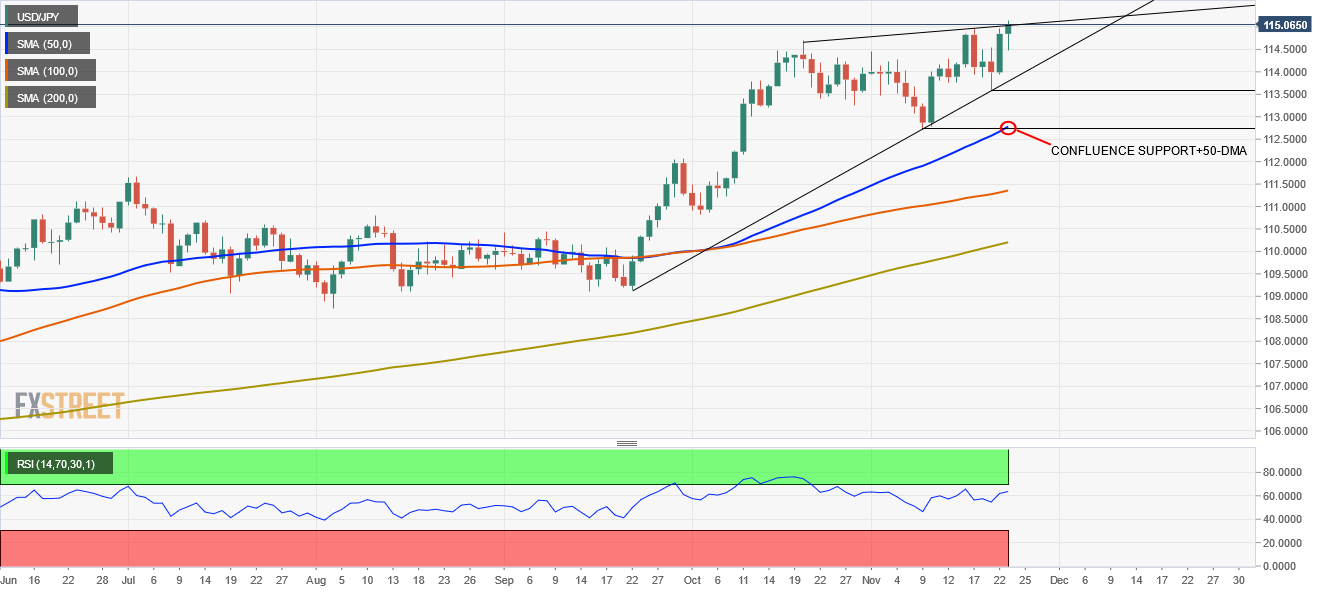
The USD/JPY has an upward bias, depicted by the daily moving averages (DMA’s) located below the spot price, with an upslope, confirming the bullish bias. However, Tuesday’s price action found strong resistance around the 115.00 area, close to the top-trendline of a bearish-wedge formation which usually breaks to the downside. A failure to overcome the abovementioned would open the door for a correction.
In that outcome, key support levels would be exposed, with the first support level at the November 19 cycle low at 113.58, followed by the confluence of the 50-DMA and the November 9 pivot low around the 112.70-80 area.
Conversely, if the USD/JPY has an upside break invalidating the bearish-wedge formation, it would open the door for higher prices, exposing crucial resistance areas. The March 2017 swing high at 115.51, followed by the 117.56.
Author

Christian Borjon Valencia
FXStreet
Markets analyst, news editor, and trading instructor with over 14 years of experience across FX, commodities, US equity indices, and global macro markets.


