USD/JPY grinds into the middle just above 145.00 ahead of the year’s final Fed rate call
- The USD/JPY tightens into a middling range just north of 145.00.
- The Fed’s last rate statement for the year is expected to be a third straight rate hold.
- US PPI figures missed the mark, but inflation remains a consumer-facing problem.

The USD/JPY is getting boxed into a tight consolidation range as markets hunker down ahead of the US Federal Reserve’s (Fed) final appearance for 2023. Markets are broadly expecting a shift in the Fed’s policy stance as investors anticipate an accelerated path toward multiple rate hikes in 2024.
With the Fed broadly expected to stand pat on interest rates for the third straight meeting, investors will be deep-diving into the Fed’s Monetary Policy Statement and the attached Interest Rate Expectations, also known as the “dot plot”, a summary of interest rate forecasts from individual Fed policymakers. At the last read in September, the Federal Open Market Committee (FOMC) expected Personal Consumption Expenditure (PCE) inflation to decline to 3.3% by the end of 2023 and 2.2% by year-end 2025. Investors eager for rate cuts will be looking for the FOMC’s dot plot to shift downwards, implying more frequent rate cuts looking forward.
Read More: Federal Reserve dot plot expected to signal upcoming policy pivot
With the Fed dominating markets in the mid-week trading session, other calendar events are getting pushed off the table for the time being, but the latter half of the trading week still brings US November Retail Sales on Thursday, followed by Friday’s Preliminary US S&P Global Purchasing Manager Index (PMI) figures for December.
US Retail Sales for November are expected to print at -0.1%, a minor decline but in-line with October’s -0.1%.
December’s US PMI figures are forecast to see slight declines in both the Services and Manufacturing components; US Services PMI is forecast to print at 49.3 versus the previous 49.4, while the Manufacturing PMI is seen declining slightly from 50.8 to 50.6.
USD/JPY Technical Outlook
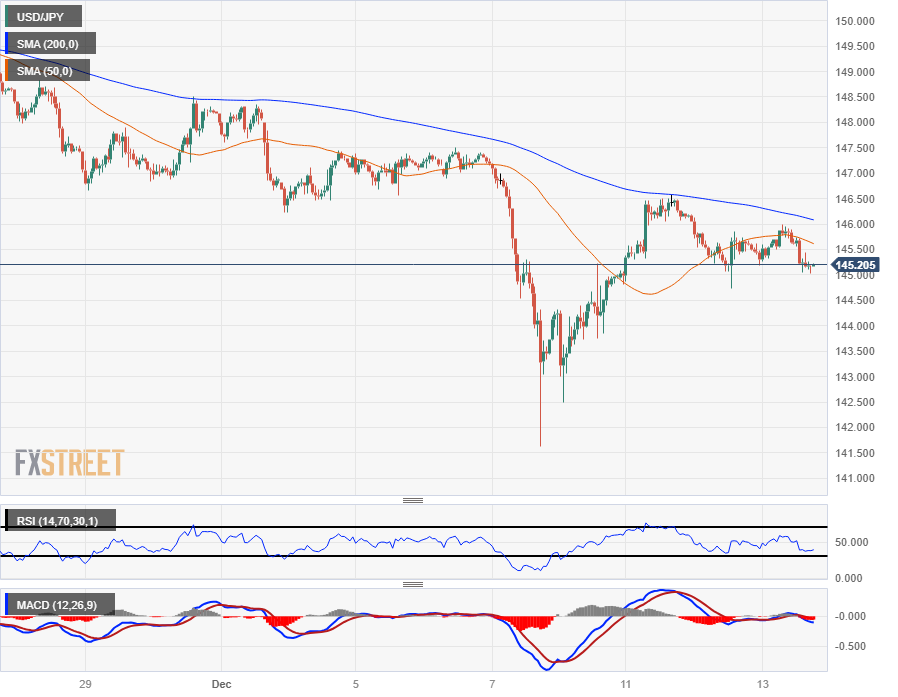
The USD/JPY is seeing a rough box forming on the intraday charts as the technicals take a step down against major fundamental events, leaving the pair to cycle around 145.50 in the midweek market session.
The USD/JPY is caught in the middling recovery range of last week’s plunge into 141.60, with the bullish rebound getting capped off by resistance from the 200-hour Simple Moving Average (SMA) descending into the 146.00 handle, and near-term chart action is seeing technical support from the 145.00 handle.
The Japanese Yen is one of the better-performing of the major currencies bloc on Wednesday, but the JPY is still in the red against the majority of its peers on the week.
The USD/JPY is down a little under a tenth of a percent from Wednesday’s opening bids, but still up roughly a sixth of a percent on the week.
USD/JPY Hourly Chart
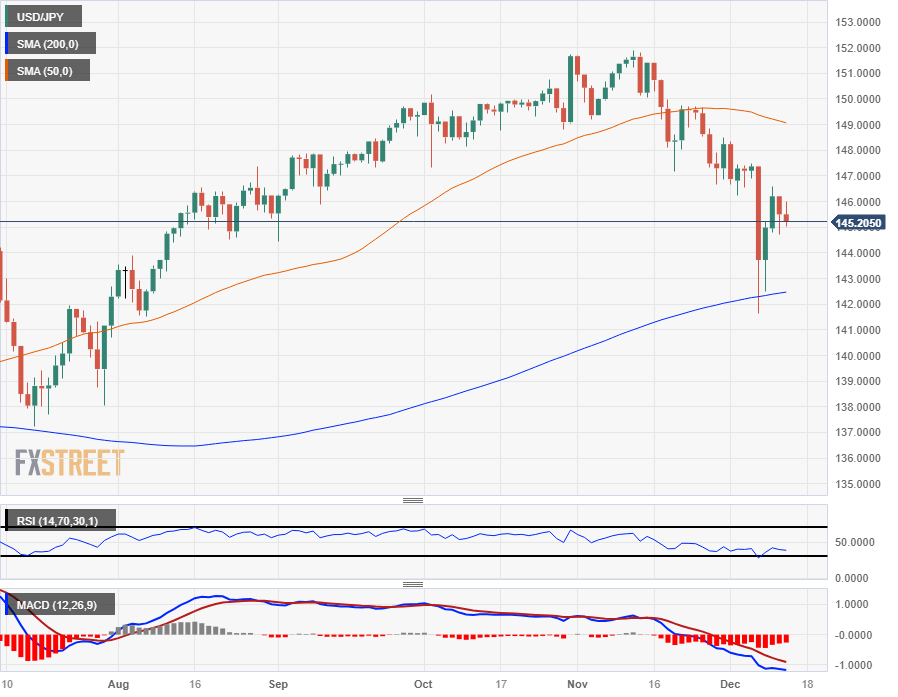
USD/JPY Daily Chart
USD/JPY Technical Levels
Author

Joshua Gibson
FXStreet
Joshua joins the FXStreet team as an Economics and Finance double major from Vancouver Island University with twelve years' experience as an independent trader focusing on technical analysis.


