|

USD/JPY falls below the 20-day SMA after US PPI, ahead of the Fed

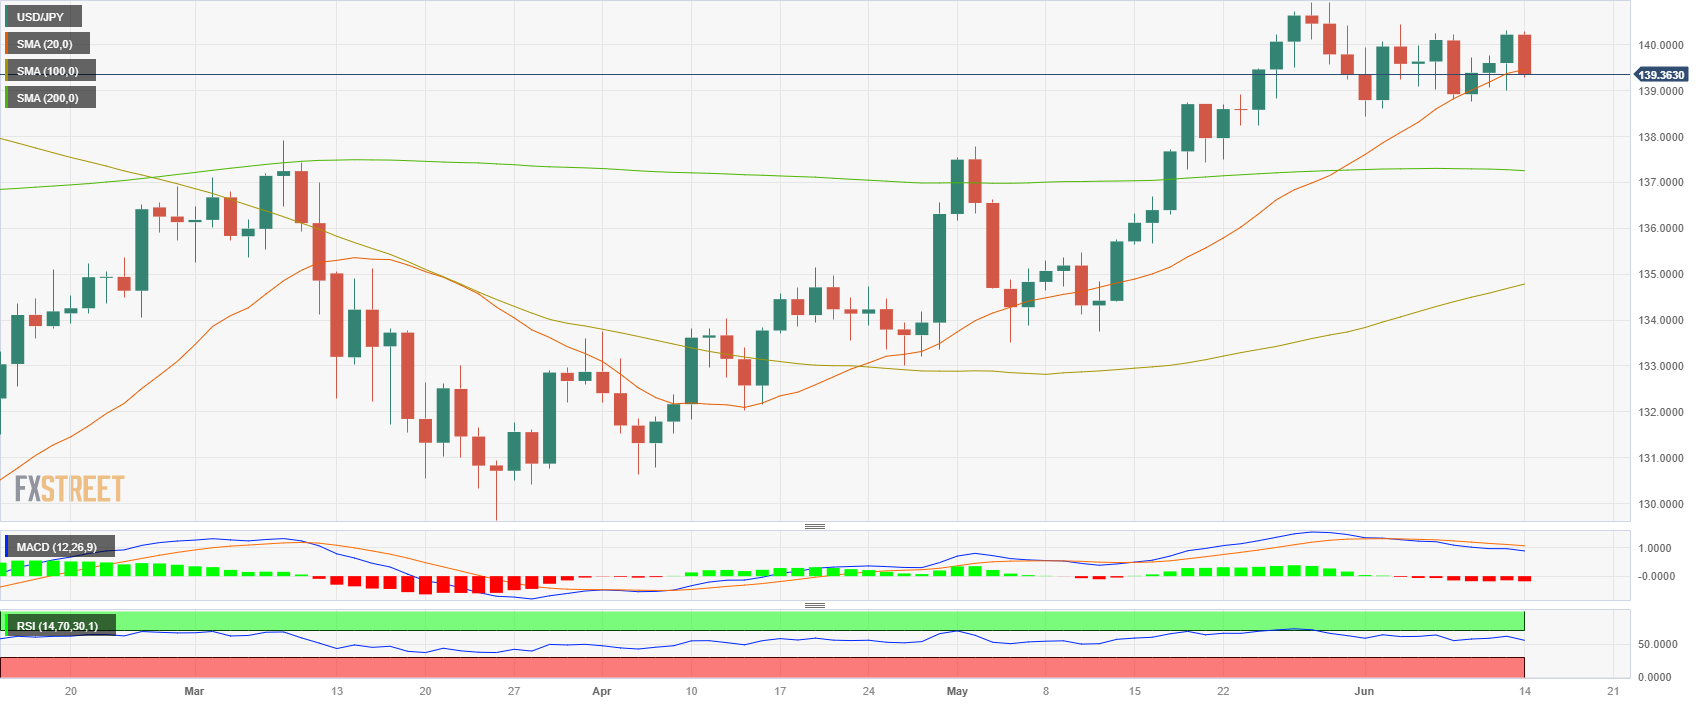
  • USD/JPY lost the 20-day SMA at 139.44 and trades at the 139.35 area.
  • The US Producer Price Index decreased by 0.3% MoM in May.
  • Investors await Fed's decision and revised dot plots.

The USD/JPY lost over 60 pips during the New York session as the Greenback faced severe selling pressure after Producer Price Index (PPI) data from the US showed lower-than-expected ‘factory gate’ inflation. US bond yields are in decline, favoring the JPY, Ahead of the Federal Reserve’s (Fed) decision at 18:00 GMT.

Weak PPI data made US bond yields decline, and stocks rise

The US Bureau of Labor Statistics released on Tuesday the PPI report that showed a decrease of 0.3% MoM in May, more than the 0.1% slide expected; the YoY measure fell to 1.1%. On the other hand, the Core figure rose 0.2% MoM in the same period matching expectations, while the yearly came in at 2.8%.

As a result, the US bond yields have weakened across the curve and applied pressure to the USD. The 10-year bond yield fell to 3.79%, while the 2-year yield sits at 4.62% and the 5-year yield at 3.96%, marking a 1.58% slide, respectively. Elsewhere, the S&P 500 index (SPX) rose to its highest level since April 2022 and applied further pressure to the US Dollar as riskier assets drove away demand from the safe-haven Greenback and the JPY.

Regarding the Fed’s decision, markets continue to discount a no hike, and investors will look for clues regarding forward guidance in the updated macro forecast, the revised dot plots and in Chair Powell’s press conference. As for now, analysts expect that the Fed will resume tightening in the next July meeting, where market participants are expecting a 25 basis point (bps) hike.

USD/JPY Levels to watch

In terms of technical analysis, USD/JPY maintains a neutral stance for the short term as indicators turn red on the daily chart. That being said, the trajectory for the following sessions will be determined by the Fed’s decision and the expectations for future meetings.

After losing the 20-day Simple Moving Average (SMA) at the 139.45 level, support levels for the pair line up at the psychological mark at 139.00 and the 200-day (SMA) at 137.25. Furthermore, a move above the 140.00 zone would suggest a continuation of the bullish trend for USD/JPY, with next resistances at the 140.50 area and a multi-month high at 140.90.

USD/JPY

Overview
Today last price139.35
Today Daily Change-0.87
Today Daily Change %-0.62
Today daily open140.22
 
Trends
Daily SMA20139.38
Daily SMA50136.37
Daily SMA100134.69
Daily SMA200137.28
 
Levels
Previous Daily High140.31
Previous Daily Low139.01
Previous Weekly High140.45
Previous Weekly Low138.76
Previous Monthly High140.93
Previous Monthly Low133.5
Daily Fibonacci 38.2%139.81
Daily Fibonacci 61.8%139.51
Daily Pivot Point S1139.39
Daily Pivot Point S2138.55
Daily Pivot Point S3138.09
Daily Pivot Point R1140.68
Daily Pivot Point R2141.14
Daily Pivot Point R3141.98

Author

Patricio Martín

Patricio is an economist from Argentina passionate about global finance and understanding the daily movements of the markets.

More from Patricio Martín
Share:

Editor's Picks

EUR/USD remains weak near 1.1800

EUR/USD rapidly fades Tuesday’s uptick and resumes its weekly retracement, challenging the 1.1800 support at the end of the NA session on Wednesday. The pair’s drop comes in response to extra gains in the US Dollar. Moving forward, the ECB meets on Thursday and is seen leaving its policy rate unchanged.
 

GBP/USD flirts with daily lows near 1.3640

GBP/USD is giving back Tuesday’s gains on Wednesday, facing renewed selling pressure and drifting towards the 1.3640 zone, or daily lows. The pullback comes as the Greenback picks up some decent traction, while investors position ahead of the BoE’s Super Thursday.

Gold stays offered below $5,000

Gold is back under pressure on Wednesday, slipping below the $5,000 mark per troy ounce as Wednesday’s session draws to a close. The pullback comes amid renewed strength in the US Dollar alongside mixed moves in US Treasury yields across the curve.

Dogecoin Price Forecast: DOGE plummets as retail investors exit amid broad market sell-off

Dogecoin (DOGE) holds near support at $0.1000 at the time of writing on Wednesday, as bears tighten their grip on assets across the crypto market. The leading meme coin remains on the back foot, weighed down by risk-off sentiment, low retail activity and weak technicals.

Should investors abandon AI as software stocks slide?

AI is not being abandoned by markets. It is being priced more carefully. Over the past few weeks, the underperformance of software and SaaS stocks has sparked a familiar question: is the AI trade breaking down? The answer is no. 

Ripple stabilizes amid mixed signals as ETF inflows resume despite low retail activity

Ripple hovers around the $1.60 pivotal level at the time of writing on Wednesday, reflecting stable but weak sentiment across the crypto market. Intense volatility triggered a brief sell-off on Tuesday, driving the remittance token to pick up liquidity at $1.53 before recovering to the current level.