|

USD/JPY closes above 148.00 amid Fed’s hawkish stance

  • USD/JPY closed Wednesday at 148.34, up by 0.33%.
  • The Fed kept rates steady but signalled high rates will be kept for longer.
  • Monetary policy divergences could weaken the JPY still.

On Wednesday, the USD/JPY closed with gains above 148.00 as the USD got a boost amid the hawkish Federal Reserve (Fed) stance, which fueled US yields to multi-year highs.

As expected, the US Federal Reserve kept interest rates unchanged at 5.25%-5.50%. Still, it surprised the market with its projections to keep rates at 5.1% for 2024 (revised from 4.6%) and virtually sent a message that it will keep rates at restrictive levels for a longer time. In addition, the projections for rates in 2023, via the so-called dot plots, were held at 5.6% and signalled one last hike in the remainder of the year, and markets are placing bets for it to be in December. 

As a reaction, the short-term US yields rose to multi-year highs, with the 2,5 and 10-year rates advancing to 5.17%, 4.57% and 4.40%, respectively, making the US Dollar gain interest.


On the JPY’s side, eyes are on Friday's Bank of Japan (BoJ) meeting decision.  The bank has already stated that changes to monetary policy won't be considered until local wage and inflation indicators match their projections. However, markets will look for any clues to start discounting a potential lift-off in the near term. In the meantime, as the Fed’s tightening cycle isn’t over, divergences between the two banks will continue weakening the Yen unless the BoJ leaves its ultra-dovish stance.

USD/JPY Levels to watch 

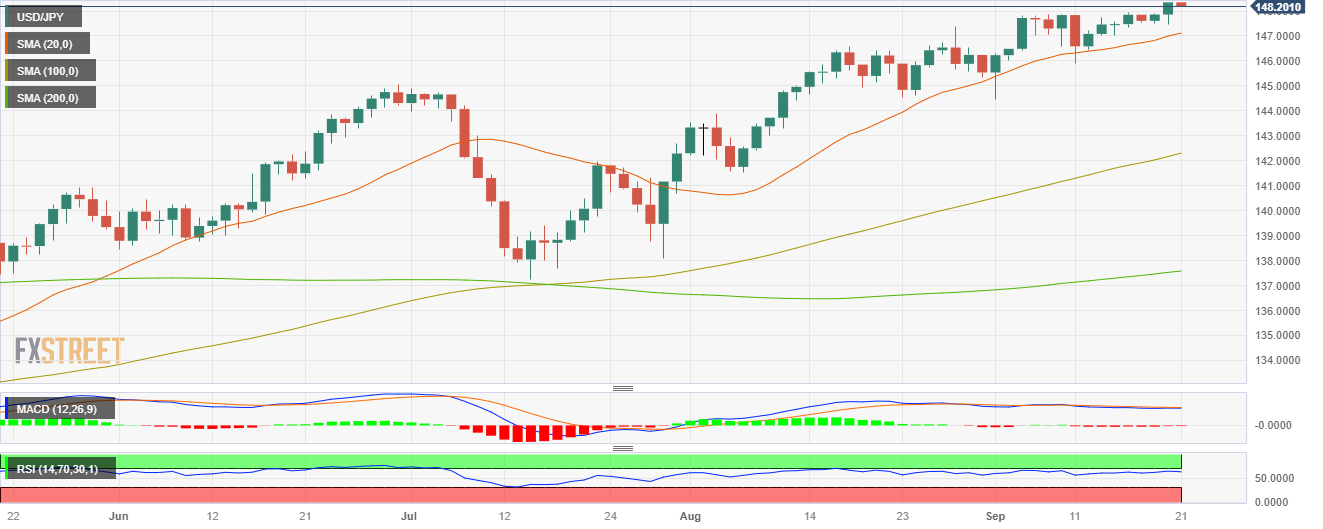
Based on the daily chart analysis, a bullish outlook is noted for USD/JPY in the near term. The Relative Strength Index (RSI) stands above its midline in positive territory, further validated by the decreasing red bars on the Moving Average Convergence Divergence (MACD). In addition, the pair is above the 20,100,200-day Simple Moving Average (SMA), indicating that the bulls are in command of the broader picture.

 Support levels: 147.80, 147.10 (20-day SMA), 146.00.

 Resistance levels: 148.50, 149.00, 150.00.

USD/JPY Daily Chart
USD/JPY

Overview
Today last price148.21
Today Daily Change0.35
Today Daily Change %0.24
Today daily open147.86
 
Trends
Daily SMA20146.82
Daily SMA50144.15
Daily SMA100142.03
Daily SMA200137.46
 
Levels
Previous Daily High147.92
Previous Daily Low147.51
Previous Weekly High147.95
Previous Weekly Low145.9
Previous Monthly High147.38
Previous Monthly Low141.51
Daily Fibonacci 38.2%147.76
Daily Fibonacci 61.8%147.67
Daily Pivot Point S1147.61
Daily Pivot Point S2147.35
Daily Pivot Point S3147.19
Daily Pivot Point R1148.02
Daily Pivot Point R2148.18
Daily Pivot Point R3148.43

Author

Patricio Martín

Patricio is an economist from Argentina passionate about global finance and understanding the daily movements of the markets.


More from Patricio Martín
Share:

Editor's Picks

AUD/USD seems vulnerable near 0.6800, 10-month low amid bullish USD

AUD/USD languishes near a 10-month low during the Asian session on Friday, awaiting a break below 0.6800 before the next leg up amid a bullish US Dollar. Firming Fed rate-hike expectations, along with fading hopes for US-Iran diplomacy, help the USD hold gains at its highest level since April 2025. Moreover, the RBA’s dovish tilt undermines the Aussie and backs the case for further losses.

USD/JPY bulls turn cautious near 160.00 amid intervention risks

USD/JPY enters a bullish consolidation phase around its highest level since early September as bulls turn cautious amid intervention risk near 160.00. Meanwhile, the downside seems cushioned as the wide US-Japan interest rate gap keeps the Yen carry trade active. Furthermore, the possibility of a jumbo Fed rate hike and Middle East uncertainties hold the US Dollar near a 19-month top, supporting the currency pair.


Gold finds temporary floor near $3,850, downside risks persist

Gold rises almost 0.9% to near $3,915 in the early trade on Friday after posting a fresh 13-month low near $3,850 the previous day. The recovery move in the Gold price after a massive decline in the past few days started Tuesday appears to be short-lived as several headwinds are boosting bears to keep up the dominance.

Bitcoin slips below $70,000 for the first time since August

Bitcoin is attracting some serious sellers, pushing it below $70,000 on Friday after an over 3% decline the previous day. The Crypto King is down over 5% so far this week, and a bearish close could mark its sixth consecutive week of losses. The technical outlook for Bitcoin is bearish, with sellers tightening their grip despite overextending the downtrend to oversold levels.

Asian stocks post mixed results amid Nvidia leadership turmoil, Anthropic IPO buzz
Asian stocks post mixed results on Friday, with Japan’s Nikkei 225 Index climbing 0.91% to around 61,370 and China’s Shanghai Composite rising 0.22% to 3,660. Conversely, Hong Kong’s Hang Seng Index fell 0.82% to 23,810, while South Korea’s KOSPI declined 0.49% to near 5,320.
What the US CPI headline doesn’t tell you about inflation

Brent crude has fallen about a third since mid-October on hopes the Iran war is ending, but diesel, freight and fertiliser costs haven't followed. Those costs reach US consumer prices in stages through 2027 and could keep inflation high after gasoline gets cheaper.