- USD/JPY traders await the US CPI data for the next major scheduled catalyst.
- The price is coiled and an inverse daily head and shoulders could be in the making.
USD/JPY is attempting to move higher during a light schedule in the North American session but has run into offers as US stocks climb to fresh highs for the week. at the time of writing, USD/JPY is trading back to flat for the day at 132.35 but has travelled between a low of 132.06 and 132.87 the high for Tuesday and the week so far.
Wall Street's main indexes are bid as investors keenly await the US consumer price index which seems to have weighed on the US Dollar and US Treasury yields in the recent hours of the session. The 10-year yield is now down by 1.66% and meeting an hourly support structure near 3.563%. If this were to hold, this would offer the greenback some support also and fend off the USD/JPY bears leaving the cross to tread water into the CPI data on Thursday where traders expect to get more clarity on the Federal Reserve's rate hike trajectory.
In this regard, analysts at TD Securities explained that they are looking for core prices to have edged higher on a monthly basis in December, ''closing out the year on a relatively stronger footing,'' they said.
''Indeed, we forecast a firm 0.3% MoM increase, as services inflation likely gained momentum. In terms of the headline, we expect CPI inflation to register a slight decline on an unrounded basis in December, but rounded up to flat MoM, as energy prices offered large relief again. Our MoM projections imply that headline and core CPI inflation likely lost speed on a YoY basis in December.''
As for the US Dollar, the analysts said ''Unless the core measure significantly surprises to the upside, USD rallies should be sold into. We think the bar is high to compel a reversal of fortune despite the USD tactically stretched.''
USD/JPY technical analysis
As per the prior analysis, USD/JPY Price Analysis: Consolidation into US CPI, bulls on the prowl, the price is coiled and an inverse daily head and shoulders could be in the making:
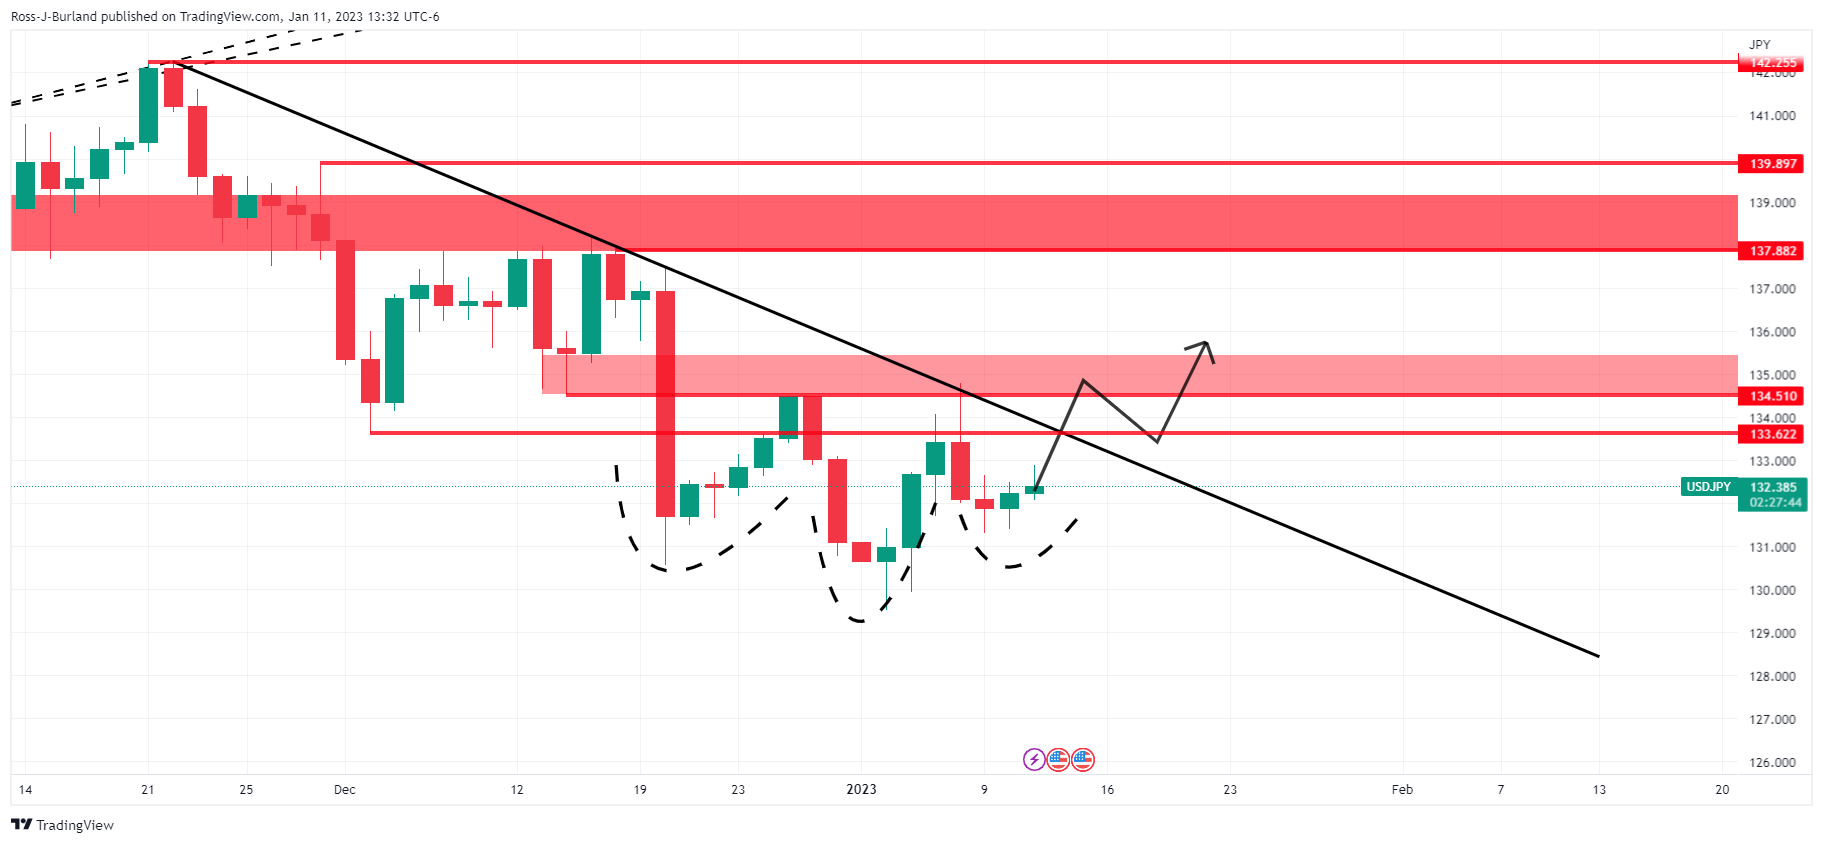
Such an outcome would take out the daily resistance and tie in with the bullish outlook for DXY as follows, where an M-formation is in play:
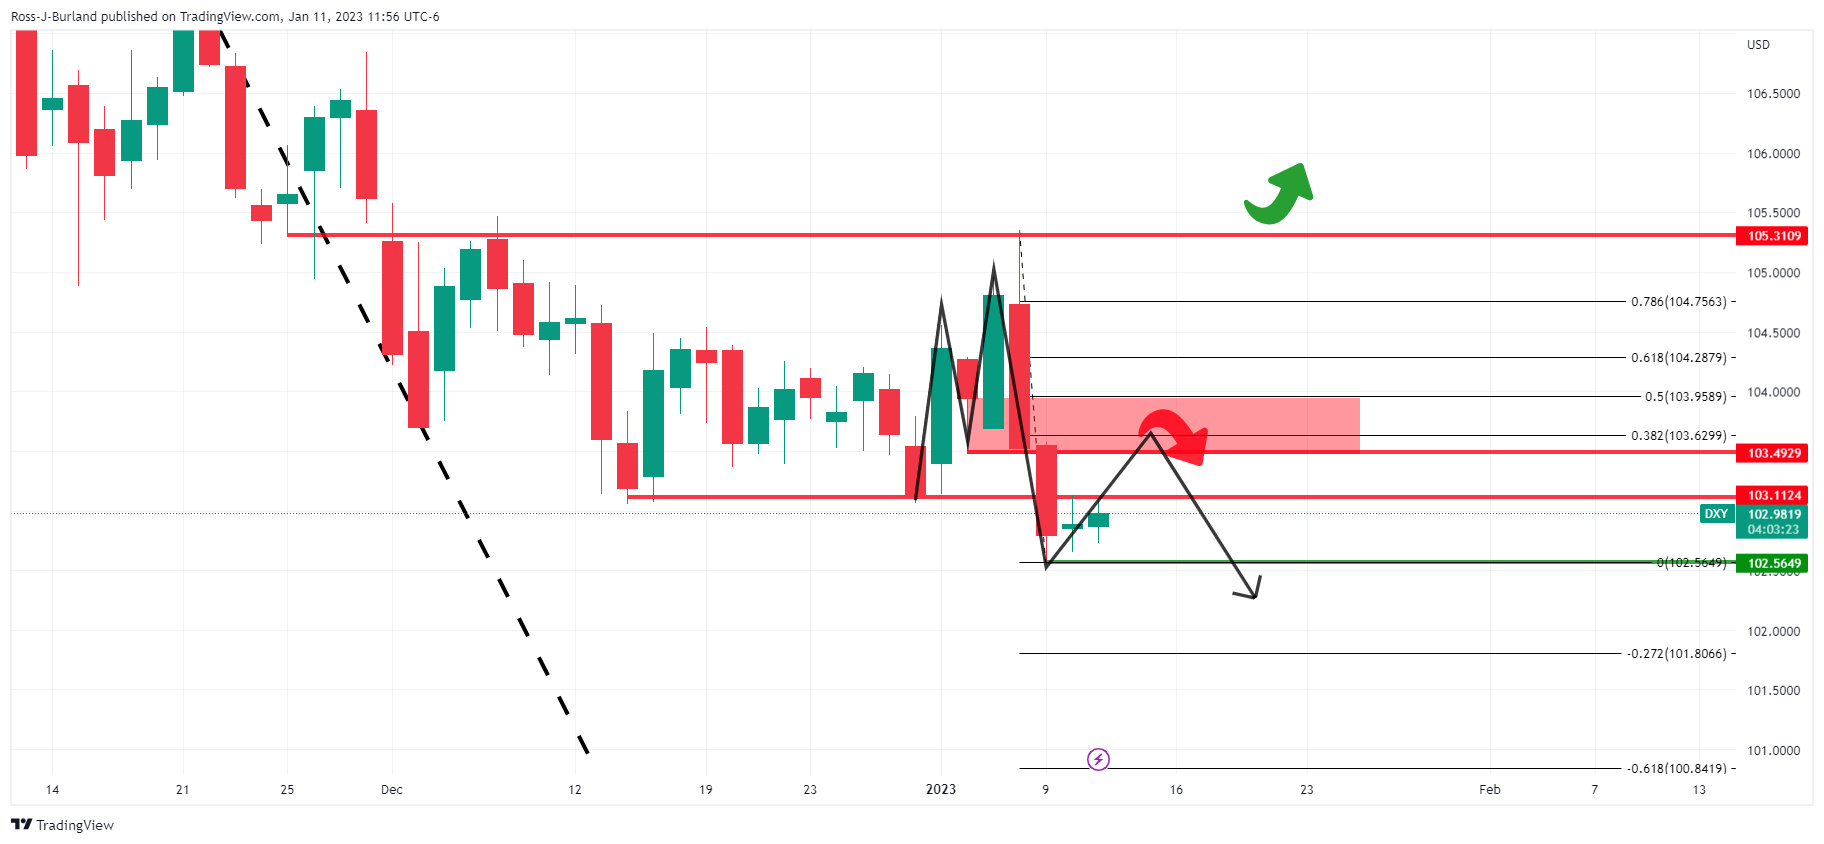
The M-formation is a reversion pattern and the price would be expected to move in for the restest of the resistance structures and neckline of the pattern between 103.50 and 104.00. Such a move would align with a 38.2% Fibonacci retracement and a 50% mean reversion at the extreme.
Information on these pages contains forward-looking statements that involve risks and uncertainties. Markets and instruments profiled on this page are for informational purposes only and should not in any way come across as a recommendation to buy or sell in these assets. You should do your own thorough research before making any investment decisions. FXStreet does not in any way guarantee that this information is free from mistakes, errors, or material misstatements. It also does not guarantee that this information is of a timely nature. Investing in Open Markets involves a great deal of risk, including the loss of all or a portion of your investment, as well as emotional distress. All risks, losses and costs associated with investing, including total loss of principal, are your responsibility. The views and opinions expressed in this article are those of the authors and do not necessarily reflect the official policy or position of FXStreet nor its advertisers. The author will not be held responsible for information that is found at the end of links posted on this page.
If not otherwise explicitly mentioned in the body of the article, at the time of writing, the author has no position in any stock mentioned in this article and no business relationship with any company mentioned. The author has not received compensation for writing this article, other than from FXStreet.
FXStreet and the author do not provide personalized recommendations. The author makes no representations as to the accuracy, completeness, or suitability of this information. FXStreet and the author will not be liable for any errors, omissions or any losses, injuries or damages arising from this information and its display or use. Errors and omissions excepted.
The author and FXStreet are not registered investment advisors and nothing in this article is intended to be investment advice.
Recommended content
Editors’ Picks
EUR/USD trades weak below 1.0800 amid Good Friday lull, ahead of US PCE
EUR/USD remains depressed below 1.0800 after soft French inflation data, amid minimal volatility and thin liquidity on Good Friday. The pair keenly awaits the US PCE inflation data and Fed Chair Powell's speech for fresh hints on next week's price action.
GBP/USD holds steady above 1.2600 as markets stay calm on Good Friday
GBP/USD trades sideways above 1.2600 amid a typical Good Friday trading lull. A broadly firmer US Dollar could keep any upside attempts limited in the pair ahead of the US PCE inflation data and Fed Chair Powell's appearance.
Gold price sits at all-time highs above $2,230, US PCE eyed
Gold price hit all-time highs at $2,236 on Thursday to finish Q1 2024 with a bang. Most major world markets, including the US are closed due to Holy Friday, leaving volatility around Gold price highly subdued. US PCE inflation and Powell are awaited.
Jito price could hit $6 as JTO coils up inside this bullish pattern
Jito (JTO) price has been on an uptrend since forming a local bottom in early January. Since then, JTO has revisited the key swing point formed in early December, suggesting the bulls’ intention to move higher.
Key events in developed markets next week
Next week, the main focus will be inflation and the labour market in the Eurozone. We expect services inflation to be impacted by the easter effect, while the unemployment rate to be unchanged.